
Wazuh-agent troubleshooting guide.
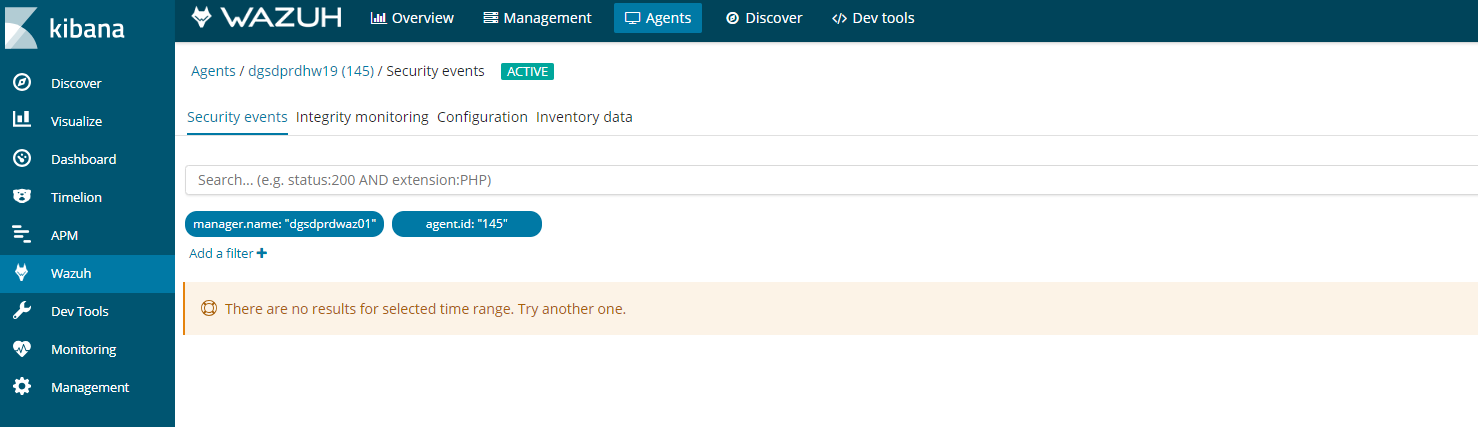
If you see this error in kibana on an agent. It could be for a number of reasons.
Follow this process to figure it out.
- Agent buffer on the client is full, which is caused by flood of alerts. The agents have a buffer size to keep resources on the clients consistent and minimal. If this fills up then kibana will stop collecting data.
- The first step is the easiest log into the client and restart the client by
- Systemctl restart wazuh-agent
- /etc/init.d/wazuh-agent restart
- And windows open the agent and click on restart
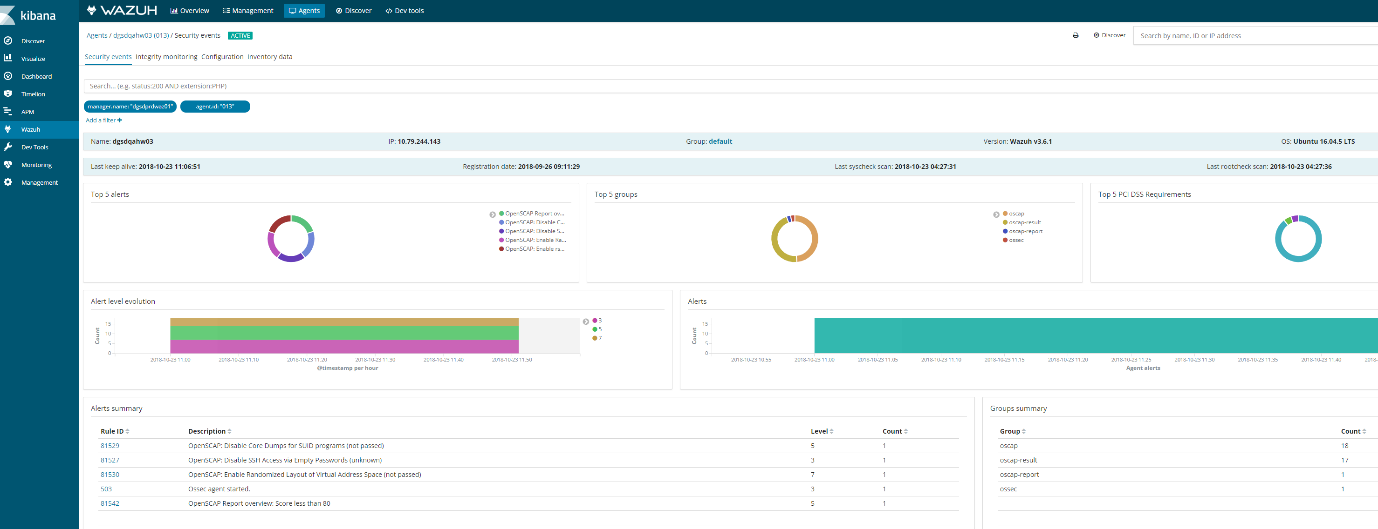
- If you go kibana
- Click on agents
- Then find your agent
- Click on a agent
- Click security audit
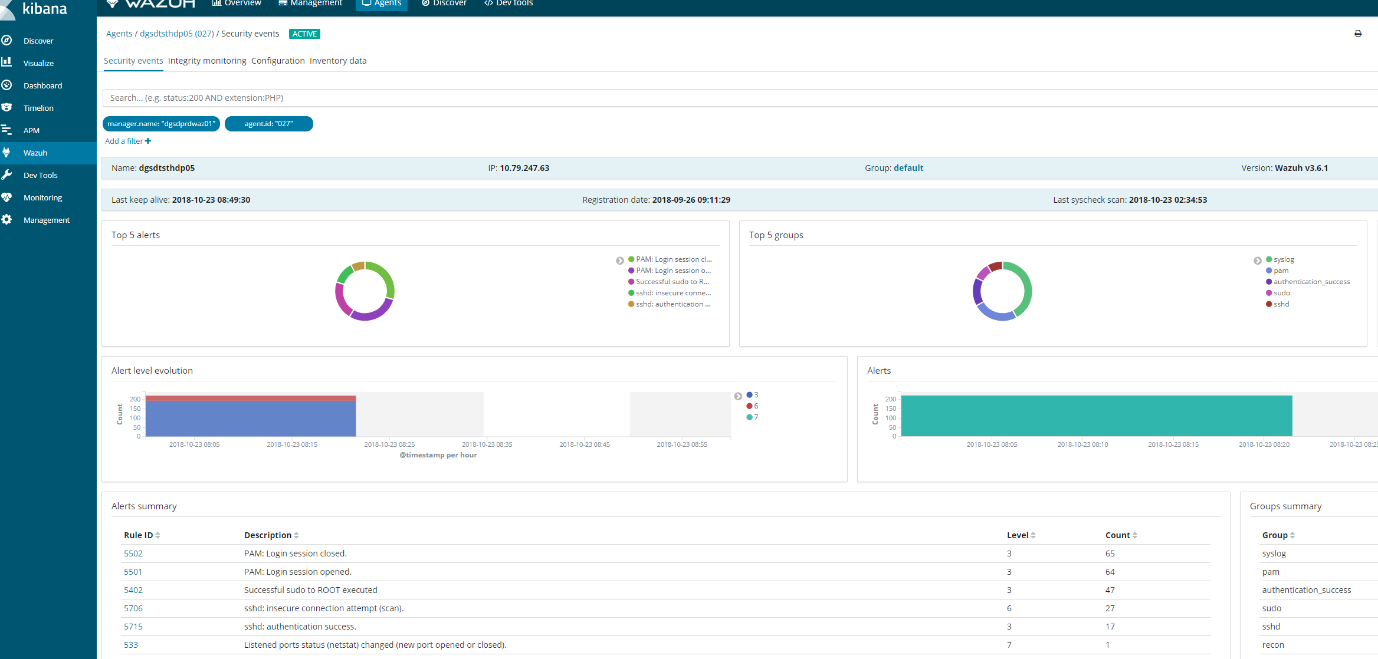
It should look something like this.
If this does not appear then we need to check wazuh-manager
Reason1 :Space issues
Logs can stop generating if elastic-search partition reaches 85% full and put the manager into read only mode.
# ls /usr/share/elasticsearch/data/ (lives on a different lvm)
# ls /var/ossec (lives on a different lvm)
-
- Ensure these partitions have plenty of space or wazuh will go into read only mode
- Ones you have ensure there is adequate space you will need to execute a command in kibana to get it working again.
PUT _settings{ “index“ : { “blocks.read_only“ : “false” }}
-
- In kibana, go to dev tools and put the above code and play the code.
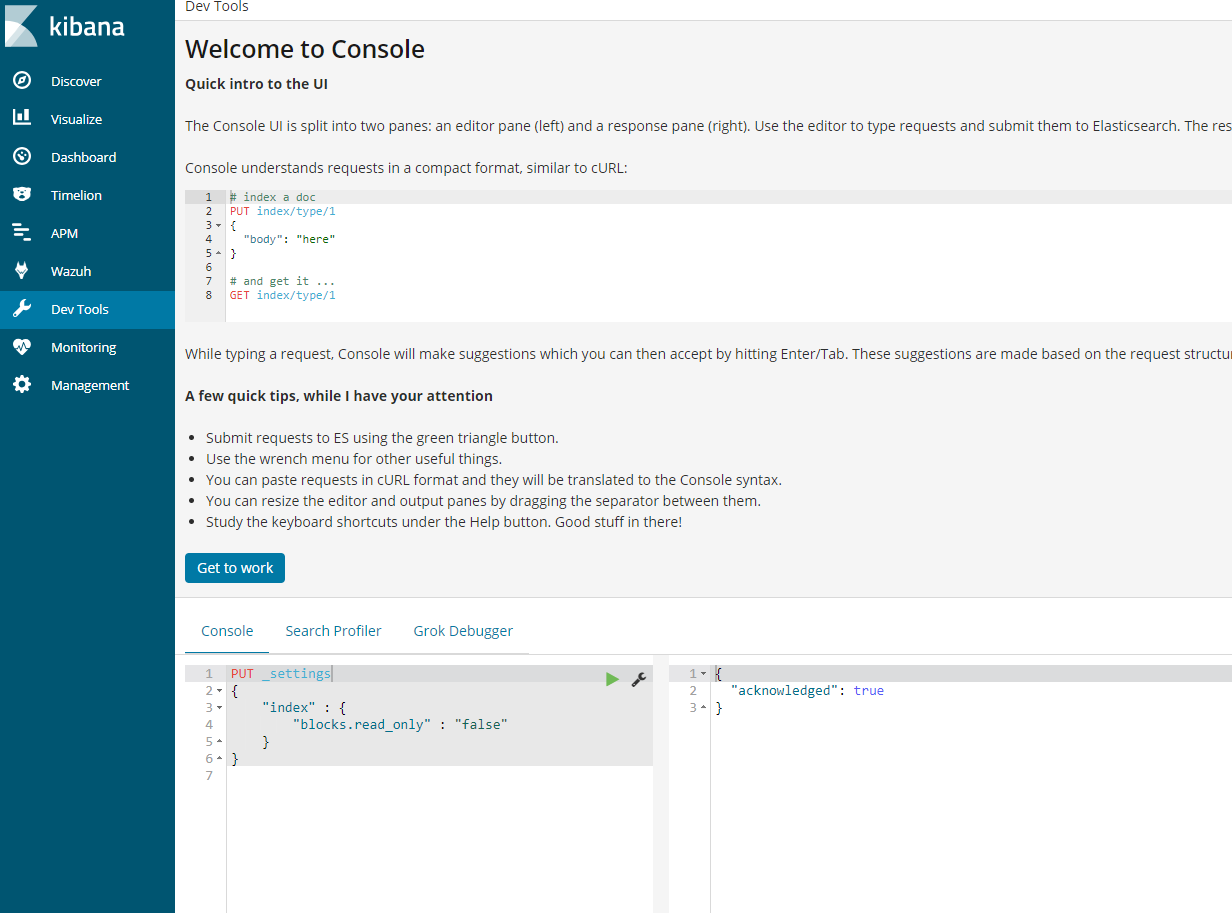
Alternative command that does the same thing.
- curl –XPUT ‘http://localhost:9200/_settings‘ –H ‘Content-Type: application/json’ –d‘ { “index”: { “blocks”: { “read_only_allow_delete“: “false” } } } ‘
- Next restart wazuh-manager and ossec
- /var/ossec/bin/ossec-control restart
- Systemctl restart wazuh-manager
Reason 2: Ensure services are running and check versions
- Elasticsearch:curl –XGET ‘localhost:9200’
[root@waz01~]# curl localhost:9200/_cluster/health?pretty
{
“cluster_name” : “elasticsearch“,
“status” : “yellow”,
“timed_out” : false,
“number_of_nodes” : 1,
“number_of_data_nodes” : 1,
“active_primary_shards” : 563,
“active_shards” : 563,
“relocating_shards” : 0,
“initializing_shards” : 0,
“unassigned_shards” : 547,
“delayed_unassigned_shards” : 0,
“number_of_pending_tasks” : 0,
“number_of_in_flight_fetch” : 0,
“task_max_waiting_in_queue_millis” : 0,
“active_shards_percent_as_number” : 50.72072072072073
}
- Kibana:/usr/share/kibana/bin/kibana –V
[root@waz01 ~]# /usr/share/kibana/bin/kibana -V
6.4.0Logstash:/usr/share/logstash/bin/logstash –V
[root@waz01 ~]# /usr/share/logstash/bin/logstash -V
logstash 6.4.2
-
- Check to see if wazuh-manager and logstash are running
- systemctl status wazuh–manager
Active and working
[root@waz01 ~]#systemctl status wazuh-manager
● wazuh-manager.service – Wazuh manager
Loaded: loaded (/etc/systemd/system/wazuh-manager.service; enabled; vendor preset: disabled)
Active: active (running) since Thu 2018-10-18 12:25:53 BST; 4 days ago
Process: 4488 ExecStop=/usr/bin/env ${DIRECTORY}/bin/ossec-control stop (code=exited, status=0/SUCCESS)
Process: 4617 ExecStart=/usr/bin/env ${DIRECTORY}/bin/ossec-control start (code=exited, status=0/SUCCESS)
CGroup: /system.slice/wazuh-manager.service
├─4635 /var/ossec/bin/ossec-authd
├─4639 /var/ossec/bin/wazuh-db
├─4656 /var/ossec/bin/ossec-execd
├─4662 /var/ossec/bin/ossec-analysisd
├─4666 /var/ossec/bin/ossec-syscheckd
├─4672 /var/ossec/bin/ossec-remoted
├─4675 /var/ossec/bin/ossec-logcollector
├─4695 /var/ossec/bin/ossec-monitord
└─4699 /var/ossec/bin/wazuh-modulesd
Oct 18 12:25:51 waz01env[4617]: Started wazuh-db…
Oct 18 12:25:51 waz01env[4617]: Started ossec-execd…
Oct 18 12:25:51 waz01env[4617]: Started ossec-analysisd…
Oct 18 12:25:51 waz01env[4617]: Started ossec-syscheckd…
Oct 18 12:25:51 waz01env[4617]: Started ossec-remoted…
Oct 18 12:25:51 waz01env[4617]: Started ossec-logcollector…
Oct 18 12:25:51 waz01env[4617]: Started ossec-monitord…
Oct 18 12:25:51 waz01env[4617]: Started wazuh-modulesd…
Oct 18 12:25:53 waz01env[4617]: Completed.
Oct 18 12:25:53 waz01systemd[1]: Started Wazuh manager.
- systemctl status logstash
Active and working
[root@waz01~]#systemctl status logstash
● logstash.service – logstash
Loaded: loaded (/etc/systemd/system/logstash.service; enabled; vendor preset: disabled)
Active: active (running) since Mon 2018-10-15 23:44:21 BST; 1 weeks 0 days ago
Main PID: 11924 (java)
CGroup: /system.slice/logstash.service
└─11924 /bin/java -Xms1g -Xmx1g –XX:+UseParNewGC -XX:+UseConcMarkSweepGC –XX:CMSInitiatingOccupancyFraction=75 -XX:+UseCMSInitiatingOccupancyOnly –Djava.awt.headless=true –Dfile.encoding=UTF-8 –Djruby.compile.invokedynamic=true –Djruby.jit.threshold=0 -XX:+HeapDumpOnOutOfMemoryError –Djava.security.egd=file:/dev/urandom -cp /usr/share/logstash/logstash-core/lib/jars/animal-sniffer-annotations-1.14.jar:/usr/share/logstash/logstash-core/lib/jars/commons-codec-1.11.jar:/u…
Oct 15 23:44:41 waz01logstash[11924]: [2018-10-15T23:44:41,581][WARN ][logstash.outputs.elasticsearch] Detected a 6.x and above cluster: the `type` event field won’t be used to determine the document _type {:es_version=>6}
Oct 15 23:44:41 waz01logstash[11924]: [2018-10-15T23:44:41,604][INFO ][logstash.outputs.elasticsearch] New Elasticsearch output {:class=>”LogStash::Outputs::ElasticSearch“, :hosts=>[“//localhost:9200”]}
Oct 15 23:44:41 waz01logstash[11924]: [2018-10-15T23:44:41,616][INFO ][logstash.outputs.elasticsearch] Using mapping template from {:path=>nil}
Oct 15 23:44:41 waz01logstash[11924]: [2018-10-15T23:44:41,641][INFO ][logstash.outputs.elasticsearch] Attempting to install template {:manage_template=>{“template”=>”logstash-*”, “version”=>60001, “settings”=>{“index.refresh_interval“=>”5s”}, “mappings”=>{“_default_”=>{“dynamic_templates”=>[{“message_field”=>{“path_match”=>”mess
Oct 15 23:44:41 waz01logstash[11924]: [2018-10-15T23:44:41,662][INFO ][logstash.filters.geoip ] Using geoip database {:path=>”/usr/share/logstash/vendor/bundle/jruby/2.3.0/gems/logstash-filter-geoip-5.0.3-java/vendor/GeoLite2-City.mmdb”}
Oct 15 23:44:41 waz01logstash[11924]: [2018-10-15T23:44:41,925][INFO ][logstash.inputs.file ] No sincedb_path set, generating one based on the “path” setting {:sincedb_path=>”/var/lib/logstash/plugins/inputs/file/.sincedb_b6991da130c0919d87fbe36c3e98e363″, :path=>[“/var/ossec/logs/alerts/alerts.json“]}
Oct 15 23:44:41 waz01logstash[11924]: [2018-10-15T23:44:41,968][INFO ][logstash.pipeline ] Pipeline started successfully {:pipeline_id=>”main”, :thread=>”#<Thread:0x63e37301 sleep>”}
Oct 15 23:44:42 waz01logstash[11924]: [2018-10-15T23:44:42,013][INFO ][logstash.agent ] Pipelines running {:count=>1, :running_pipelines=>[:main], :non_running_pipelines=>[]}
Oct 15 23:44:42 waz01logstash[11924]: [2018-10-15T23:44:42,032][INFO ][filewatch.observingtail ] START, creating Discoverer, Watch with file and sincedb collections
Oct 15 23:44:42 waz01logstash[11924]: [2018-10-15T23:44:42,288][INFO ][logstash.agent ] Successfully started Logstash API endpoint {:port=>9600}
If any of these are failed restart them.
- systemctl restart logstashsystemctl restart elasticsearchsystemctl restart wazuh-manger
Reason 3: Logstash is broken
- Check the logs for errors.
- tail /var/log/logstash/logstash-plain.log
Possible error#1 :
[root@waz01 ~]# tail /var/log/logstash/logstash-plain.log
[2018-10-09T17:37:59,475][INFO ][logstash.outputs.elasticsearch] Retrying individual bulk actions that failed or were rejected by the previous bulk request. {:count=>1}
[2018-10-09T17:37:59,475][INFO ][logstash.outputs.elasticsearch] retrying failed action with response code: 403 ({“type”=>”cluster_block_exception“, “reason”=>”blocked by: [FORBIDDEN/12/index read-only / allow delete (api)];”})
[2018-10-09T17:37:59,475][INFO ][logstash.outputs.elasticsearch] retrying failed action with response code: 403 ({“type”=>”cluster_block_exception“, “reason”=>”blocked by: [FORBIDDEN/12/index read-only / allow delete (api)];”})
[2018-10-09T17:37:59,475][INFO ][logstash.outputs.elasticsearch] Retrying individual bulk actions that failed or were rejected by the previous bulk request. {:count=>2}
[2018-10-09T17:37:59,475][INFO ][logstash.outputs.elasticsearch] retrying failed action with response code: 403 ({“type”=>”cluster_block_exception“, “reason”=>”blocked by: [FORBIDDEN/12/index read-only / allow delete (api)];”})
[2018-10-09T17:37:59,475][INFO ][logstash.outputs.elasticsearch] Retrying individual bulk actions that failed or were rejected by the previous bulk request. {:count=>1}
[2018-10-09T17:37:59,475][INFO ][logstash.outputs.elasticsearch] Retrying individual bulk actions that failed or were rejected by the previous bulk request. {:count=>2}
[2018-10-09T17:37:59,475][INFO ][logstash.outputs.elasticsearch] Retrying individual bulk actions that failed or were rejected by the previous bulk request. {:count=>3}
[2018-10-09T17:37:59,476][INFO ][logstash.outputs.elasticsearch] retrying failed action with response code: 403 ({“type”=>”cluster_block_exception“, “reason”=>”blocked by: [FORBIDDEN/12/index read-only / allow delete (api)];”})
[2018-10-09T17:37:59,476][INFO ][logstash.outputs.elasticsearch] Retrying individual bulk actions that failed or were rejected by the previous bulk request. {:count=>1}
Possible error#2 :
[2018-10-15T20:06:10,967][ERROR][org.logstash.Logstash ] java.lang.IllegalStateException: Logstash stopped processing because of an error: (SystemExit) exit
[2018-10-15T20:06:26,863][FATAL][logstash.runner ] An unexpected error occurred! {:error=>#<ArgumentError: Path “/var/lib/logstash/queue” must be a writable directory. It is not writable.>, :backtrace=>[“/usr/share/logstash/logstash-core/lib/logstash/settings.rb:447:in `validate'”, “/usr/share/logstash/logstash-core/lib/logstash/settings.rb:229:in `validate_value‘”, “/usr/share/logstash/logstash-core/lib/logstash/settings.rb:140:in `block in validate_all‘”, “org/jruby/RubyHash.java:1343:in `each'”, “/usr/share/logstash/logstash-core/lib/logstash/settings.rb:139:in `validate_all‘”, “/usr/share/logstash/logstash-core/lib/logstash/runner.rb:278:in `execute'”, “/usr/share/logstash/vendor/bundle/jruby/2.3.0/gems/clamp-0.6.5/lib/clamp/command.rb:67:in `run'”, “/usr/share/logstash/logstash-core/lib/logstash/runner.rb:237:in `run'”, “/usr/share/logstash/vendor/bundle/jruby/2.3.0/gems/clamp-0.6.5/lib/clamp/command.rb:132:in `run'”, “/usr/share/logstash/lib/bootstrap/environment.rb:73:in `<main>'”]}
[2018-10-15T20:06:26,878][ERROR][org.logstash.Logstash ] java.lang.IllegalStateException: Logstash stopped processing because of an error: (SystemExit) exit
[2018-10-15T20:06:42,543][FATAL][logstash.runner ] An unexpected error occurred! {:error=>#<ArgumentError: Path “/var/lib/logstash/queue” must be a writable directory. It is not writable.>, :backtrace=>[“/usr/share/logstash/logstash-core/lib/logstash/settings.rb:447:in `validate'”, “/usr/share/logstash/logstash-core/lib/logstash/settings.rb:229:in `validate_value‘”, “/usr/share/logstash/logstash-core/lib/logstash/settings.rb:140:in `block in validate_all‘”, “org/jruby/RubyHash.java:1343:in `each'”, “/usr/share/logstash/logstash-core/lib/logstash/settings.rb:139:in `validate_all‘”, “/usr/share/logstash/logstash-core/lib/logstash/runner.rb:278:in `execute'”, “/usr/share/logstash/vendor/bundle/jruby/2.3.0/gems/clamp-0.6.5/lib/clamp/command.rb:67:in `run'”, “/usr/share/logstash/logstash-core/lib/logstash/runner.rb:237:in `run'”, “/usr/share/logstash/vendor/bundle/jruby/2.3.0/gems/clamp-0.6.5/lib/clamp/command.rb:132:in `run'”, “/usr/share/logstash/lib/bootstrap/environment.rb:73:in `<main>'”]}
[2018-10-15T20:06:42,557][ERROR][org.logstash.Logstash ] java.lang.IllegalStateException: Logstash stopped processing because of an error: (SystemExit) exit
[2018-10-15T20:06:58,344][FATAL][logstash.runner ] An unexpected error occurred! {:error=>#<ArgumentError: Path “/var/lib/logstash/queue” must be a writable directory. It is not writable.>, :backtrace=>[“/usr/share/logstash/logstash-core/lib/logstash/settings.rb:447:in `validate'”, “/usr/share/logstash/logstash-core/lib/logstash/settings.rb:229:in `validate_value‘”, “/usr/share/logstash/logstash-core/lib/logstash/settings.rb:140:in `block in validate_all‘”, “org/jruby/RubyHash.java:1343:in `each'”, “/usr/share/logstash/logstash-core/lib/logstash/settings.rb:139:in `validate_all‘”, “/usr/share/logstash/logstash-core/lib/logstash/runner.rb:278:in `execute'”, “/usr/share/logstash/vendor/bundle/jruby/2.3.0/gems/clamp-0.6.5/lib/clamp/command.rb:67:in `run'”, “/usr/share/logstash/logstash-core/lib/logstash/runner.rb:237:in `run'”, “/usr/share/logstash/vendor/bundle/jruby/2.3.0/gems/clamp-0.6.5/lib/clamp/command.rb:132:in `run'”, “/usr/share/logstash/lib/bootstrap/environment.rb:73:in `<main>'”]}
[2018-10-15T20:06:58,359][ERROR][org.logstash.Logstash ] java.lang.IllegalStateException: Logstash stopped processing because of an error: (SystemExit) exi
Probably need to reinstall logstash
1. Stop affected services:
# systemctl stop logstash# systemctl stop filebeat (this should not be installed on a stand alone setup as it causes performance issues.
2. Remove Filebeat
# yum remove filebeat
3. Setting up Logstash
# curl -so /etc/logstash/conf.d/01-wazuh.conf https://raw.githubusercontent.com/wazuh/wazuh/3.6/extensions/logstash/01-wazuh-local.conf# usermod -a -G osseclogstash
- Next step is to correct folder owner for certain Logstash directories:
# chown -R logstash:logstash /usr/share/logstash# chown -R logstash:logstash /var/lib/logstash
Note: if logstash still shows writing issues in the logs increase the permissions to
- chmod -R 766 /usr/share/logstash
- systemctl restart logstash
Now restart Logstash:
# systemctl restart logstash
5. Restart Logstash & run the curl command to ensure its not readonly.
- # systemctl restart logstash
- curl –XPUT ‘http://localhost:9200/_settings‘ –H ‘Content-Type: application/json’ –d‘ { “index”: { “blocks”: { “read_only_allow_delete“: “false” } } } ‘
- 6. Now check again your Logstash log file:
6. Now check again your Logstash log file:
# cat /var/log/logstash/logstash-plain.log | grep –i -E “(error|warning|critical)”
Hopefully you see no errors being generated
Next check the plain log
- tail -10 /var/log/logstash/logstash-plain.log
Good log output:
[root@waz01~]# tail -10 /var/log/logstash/logstash-plain.log
[2018-10-15T23:44:41,581][WARN ][logstash.outputs.elasticsearch] Detected a 6.x and above cluster: the `type` event field won’t be used to determine the document _type {:es_version=>6}
[2018-10-15T23:44:41,604][INFO ][logstash.outputs.elasticsearch] New Elasticsearch output {:class=>”LogStash::Outputs::ElasticSearch“, :hosts=>[“//localhost:9200”]}
[2018-10-15T23:44:41,616][INFO ][logstash.outputs.elasticsearch] Using mapping template from {:path=>nil}
[2018-10-15T23:44:41,641][INFO ][logstash.outputs.elasticsearch] Attempting to install template {:manage_template=>{“template”=>”logstash-*”, “version”=>60001, “settings”=>{“index.refresh_interval“=>”5s”}, “mappings”=>{“_default_”=>{“dynamic_templates”=>[{“message_field”=>{“path_match”=>”message”, “match_mapping_type“=>”string”, “mapping”=>{“type”=>”text”, “norms”=>false}}}, {“string_fields“=>{“match”=>”*”, “match_mapping_type“=>”string”, “mapping”=>{“type”=>”text”, “norms”=>false, “fields”=>{“keyword”=>{“type”=>”keyword”, “ignore_above“=>256}}}}}], “properties”=>{“@timestamp”=>{“type”=>”date”}, “@version”=>{“type”=>”keyword”}, “geoip“=>{“dynamic”=>true, “properties”=>{“ip“=>{“type”=>”ip“}, “location”=>{“type”=>”geo_point“}, “latitude”=>{“type”=>”half_float“}, “longitude”=>{“type”=>”half_float“}}}}}}}}
[2018-10-15T23:44:41,662][INFO ][logstash.filters.geoip ] Using geoip database {:path=>”/usr/share/logstash/vendor/bundle/jruby/2.3.0/gems/logstash-filter-geoip-5.0.3-java/vendor/GeoLite2-City.mmdb”}
[2018-10-15T23:44:41,925][INFO ][logstash.inputs.file ] No sincedb_path set, generating one based on the “path” setting {:sincedb_path=>”/var/lib/logstash/plugins/inputs/file/.sincedb_b6991da130c0919d87fbe36c3e98e363″, :path=>[“/var/ossec/logs/alerts/alerts.json“]}
[2018-10-15T23:44:41,968][INFO ][logstash.pipeline ] Pipeline started successfully {:pipeline_id=>”main”, :thread=>”#<Thread:0x63e37301 sleep>”}
[2018-10-15T23:44:42,013][INFO ][logstash.agent ] Pipelines running {:count=>1, :running_pipelines=>[:main], :non_running_pipelines=>[]}
[2018-10-15T23:44:42,032][INFO ][filewatch.observingtail ] START, creating Discoverer, Watch with file and sincedb collections
[2018-10-15T23:44:42,288][INFO ][logstash.agent ] Successfully started Logstash API endpoint {:port=>9600}
Now that we have all clear, let’s check component by component:
1. Check last 10 alerts generated in your Wazuh manager. Also, check the field timestamp, we must take care about the timestamp.
tail –10 /var/ossec/logs/alerts/alerts.json
2. If the Wazuh manager is generating alerts from your view (step 1), then let’s check if Logstash is reading our alerts. You should see two processes: java for Logstash and ossec-ana from Wazuh.
# lsof /var/ossec/logs/alerts/alerts.json (ossec-ana & java should be running if not restart ossec)
[root@waz01~]#lsof /var/ossec/logs/alerts/alerts.json
COMMAND PID USER FD TYPE DEVICE SIZE/OFF NODE NAME
ossec-ana 4662ossec 10w REG 253,3 2060995503 201341089 /var/ossec/logs/alerts/alerts.json
java 11924 logstash 93r REG 253,3 2060995503 201341089 /var/ossec/logs/alerts/alerts.json
3. If Logstash is reading our alerts, let’s check if there is an Elasticsearch index for today (wazuh-alerts-3.x-2018.10.16)):
curl localhost:9200/_cat/indices/wazuh–alerts–3.x-*
[root@waz01~]# curl localhost:9200/_cat/indices/wazuh-alerts-3.x-*
yellow open wazuh-alerts-3.x-2018.09.07 HLNDuMjHS1Ox3iLoSwFE7g 5 1 294 0 1000.8kb 1000.8kb
yellow open wazuh-alerts-3.x-2018.09.25 Eg1rvDXbSNSq5EqJAtSm_A 5 1 247998 0 87.7mb 87.7mb
yellow open wazuh-alerts-3.x-2018.09.05 HHRnxqjtTKimmW6FEUUfdw 5 1 143 0 679.6kb 679.6kb
yellow open wazuh-alerts-3.x-2018.09.08 MqIJtCNQR3aU3inuv-pxpw 5 1 183 0 748kb 748kb
yellow open wazuh-alerts-3.x-2018.09.15 GIx8fMXnQ3ukrSkKmjbViQ 5 1 171191 0 45.9mb 45.9mb
yellow open wazuh-alerts-3.x-2018.10.10 W3pw1hDwSp2QAtRm0hwoaQ 5 1 896799 0 662.6mb 662.6mb
yellow open wazuh-alerts-3.x-2018.10.15 rnC7kyXRQSCSXm6wVCiWOw 5 1 2628257 0 1.8gb 1.8gb
yellow open wazuh-alerts-3.x-2018.10.02 nKEdjkFOQ9abitVi_dKF3g 5 1 727934 0 232.7mb 232.7mb
yellow open wazuh-alerts-3.x-2018.09.21 FY0mIXGQQHmCpYgRgOIJhg 5 1 203134 0 63.5mb 63.5mb
yellow open wazuh-alerts-3.x-2018.10.01 mvYSVDZJSfa-F_5dKIBwAg 5 1 402155 0 129.9mb 129.9mb
yellow open wazuh-alerts-3.x-2018.10.18 _2WiGz6fRXSNyDjy8qPefg 5 1 2787147 0 1.8gb 1.8gb
yellow open wazuh-alerts-3.x-2018.09.19 ebb9Jrt1TT6Qm6df7VjZxg 5 1 201897 0 58.3mb 58.3mb
yellow open wazuh-alerts-3.x-2018.09.13 KPy8HfiyRyyPeeHpTGKJNg 5 1 52530 0 13.7mb 13.7mb
yellow open wazuh-alerts-3.x-2018.10.23 T7YJjWhgRMaYyCT-XC1f5w 5 1 1074081 0 742.6mb 742.6mb
yellow open wazuh-alerts-3.x-2018.10.03 bMW_brMeRkSDsJWL6agaWg 5 1 1321895 0 715mb 715mb
yellow open wazuh-alerts-3.x-2018.09.18 B1wJIN1SQKuSQbkoFsTmnA 5 1 187805 0 52.4mb 52.4mb
yellow open wazuh-alerts-3.x-2018.09.04 CvatsnVxTDKgtPzuSkebFQ 5 1 28 0 271.1kb 271.1kb
yellow open wazuh-alerts-3.x-2018.10.21 AWVQ7D8VS_S0DHiXvtNB1Q 5 1 2724453 0 1.8gb 1.8gb
yellow open wazuh-alerts-3.x-2018.09.27 8wRF0XhXQnuVexAxLF6Y5w 5 1 233117 0 79.2mb 79.2mb
yellow open wazuh-alerts-3.x-2018.10.13 wM5hHYMCQsG5XCkIquE-QA 5 1 304830 0 222.4mb 222.4mb
yellow open wazuh-alerts-3.x-2018.09.12 1aB7pIcnTWqZPZkFagHnKA 5 1 73 0 516kb 516kb
yellow open wazuh-alerts-3.x-2018.09.29 BXyZe2eySkSlwutudcTzNA 5 1 222734 0 73.7mb 73.7mb
yellow open wazuh-alerts-3.x-2018.10.04 x8198rpWTxOVBgJ6eTjJJg 5 1 492044 0 364.9mb 364.9mb
yellow open wazuh-alerts-3.x-2018.09.23 ZQZE9KD1R1y6WypYVV5kfg 5 1 216141 0 73.7mb 73.7mb
yellow open wazuh-alerts-3.x-2018.09.22 60AsCkS-RGG0Z2kFGcrbxg 5 1 218077 0 74.2mb 74.2mb
yellow open wazuh-alerts-3.x-2018.10.12 WdiFnzu7QlaBetwzcsIFYQ 5 1 363029 0 237.7mb 237.7mb
yellow open wazuh-alerts-3.x-2018.09.24 Loa8kM7cSJOujjRzvYsVKw 5 1 286140 0 106.3mb 106.3mb
yellow open wazuh-alerts-3.x-2018.09.17 zK3MCinOSF2_3rNAJnuPCQ 5 1 174254 0 48.3mb 48.3mb
yellow open wazuh-alerts-3.x-2018.10.17 A4yCMv4YTuOQWelbb3XQtQ 5 1 2703251 0 1.8gb 1.8gb
yellow open wazuh-alerts-3.x-2018.09.02 lt8xvq2ZRdOQGW7pSX5-wg 5 1 148 0 507kb 507kb
yellow open wazuh-alerts-3.x-2018.08.31 RP0_5r1aQdiMmQYeD0-3CQ 5 1 28 0 247.8kb 247.8kb
yellow open wazuh-alerts-3.x-2018.09.28 iZ2J4UMhR6y1eHH1JiiqLQ 5 1 232290 0 78.6mb 78.6mb
yellow open wazuh-alerts-3.x-2018.09.09 FRELA8dFSWy6aMd12ZFnqw 5 1 428 0 895.1kb 895.1kb
yellow open wazuh-alerts-3.x-2018.09.16 uwLNlaQ1Qnyp2V9jXJJHvA 5 1 171478 0 46.5mb 46.5mb
yellow open wazuh-alerts-3.x-2018.10.14 WQV3dpLeSdapmaKOewUh-Q 5 1 226964 0 154.9mb 154.9mb
yellow open wazuh-alerts-3.x-2018.09.11 2Zc4Fg8lR6G64XuJLZbkBA 5 1 203 0 772.1kb 772.1kb
yellow open wazuh-alerts-3.x-2018.10.16 p2F-trx1R7mBXQUb4eY-Fg 5 1 2655690 0 1.8gb 1.8gb
yellow open wazuh-alerts-3.x-2018.08.29 kAPHZSRpQqaMhoWgkiXupg 5 1 28 0 236.6kb 236.6kb
yellow open wazuh-alerts-3.x-2018.08.28 XmD43PlgTUWaH4DMvZMiqw 5 1 175 0 500.9kb 500.9kb
yellow open wazuh-alerts-3.x-2018.10.19 O4QFPk1FS1urV2CGM2Ul4g 5 1 2718909 0 1.8gb 1.8gb
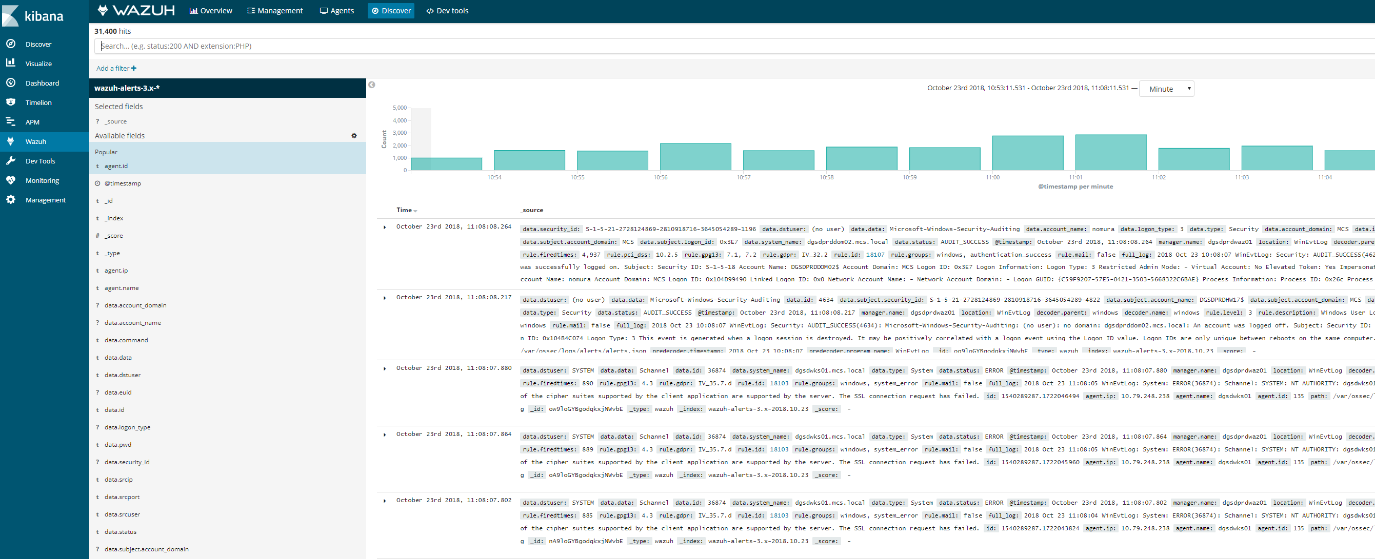
4. If Elasticsearch has an index for today (wazuh-alerts-3.x-2018.10.16), the problem is probably selected time range in Kibana. To discard any error related to this, please go to Kibana > Discover, and look for
alerts in that section of Kibana itself. If there are alerts from today in the Discover section.
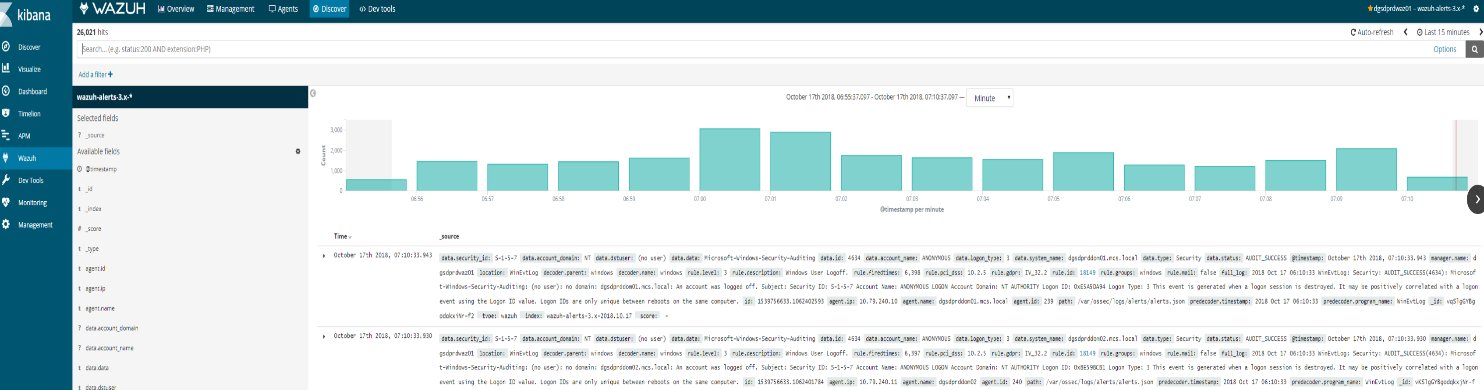
This means the Elasticsearch stack is finally working (at least at index level)
Reason 4: Agent buffer is full due to flood events. If this occurs events are not logged and data is lost. We want to drill down on a specific agent to figure out what is causing the issue.
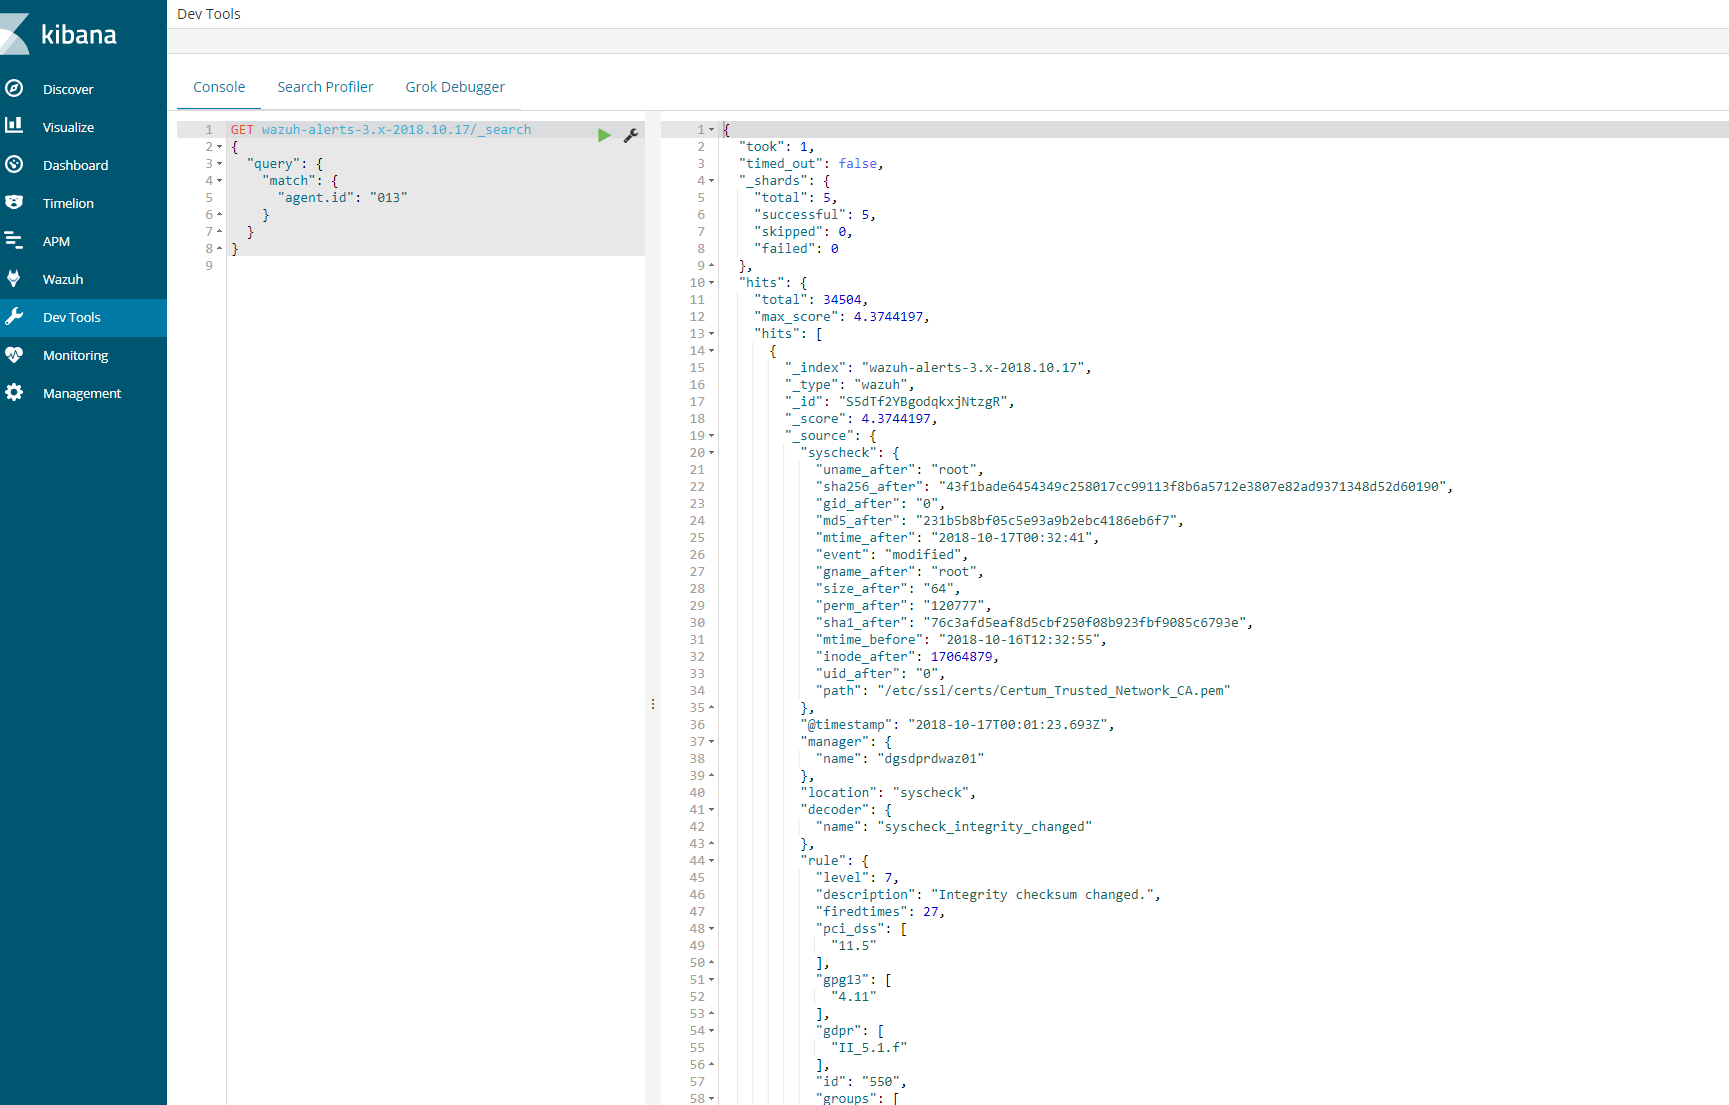
Try to fetch data directly from Elasticsearch for the today’s index and for the agent 013. Copy and paste the next query in the Kibana dev tools:
GET wazuh–alerts–3.x–2018.10.17/_search{ “query”: { “match”: { “agent.id“: “013” } }}
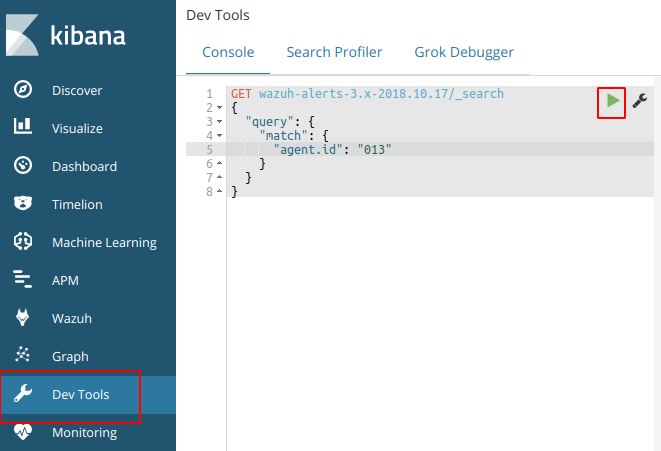
This should provide a log an output to show that the agent is logged in the indices for that day. If this is successful then we know that the logs are coming and kibana is able to communicate.
Next steps
- Login using SSH into the agent “013” and execute the next command:
wc –l /var/log/audit/audit.log cut –d‘/’ –f1 (centos)
wc –l /var/log/audit/syslog cut –d‘/’ f1(ubuntu)
- root@wazuh-03:/var/log# wc -l /var/log/syslog | cut -d’/’ -f1
- 36451
36451
Also, it would be nice if you provide us your audit rules, let’s check them using the next command:
# auditctl -l
It should show you a positive number, and that number is the number of lines in the audit.log file. Note down it.
- Now restart the Wazuh agent:
# systemctl restart wazuh-agent
We need to wait for syscheck scan is finished, this trick is useful to know exactly when it’s done:
# tail -f /var/ossec/logs/ossec.log | grep syscheck | grep Ending
The above command shouldn’t show anything until the scan is finished (it could take some time, be patient please). At the end, you should see a line like this:
2018/10/17 13:36:03 ossec–syscheckd: INFO: Ending syscheck scan (forwarding database).
Now, it’s time for checking the audit.log file again:
wc –l /var/log/audit/audit.log cut –d‘/’ –f1
wc –l /var/log/audit/syslog cut –d‘/’ f1
If you still see the agent buffer full after these steps then we need to do debugging.
tail -f /var/ossec/logs/ossec.log | grep syscheck | grep Ending
root@waz03:/var/log# cat /var/ossec/logs/ossec.log | grep –i -E “(error|warning|critical)”
2018/10/17 00:09:08 ossec-agentd: WARNING: Agent buffer at 90 %.
2018/10/17 00:09:08 ossec-agentd: WARNING: Agent buffer is full: Events may be lost.
2018/10/17 12:10:20 ossec-agentd: WARNING: Agent buffer at 90 %.
2018/10/17 12:10:20 ossec-agentd: WARNING: Agent buffer is full: Events may be lost.
2018/10/17 14:25:20 ossec-logcollector: ERROR: (1103): Could not open file ‘/var/log/messages’ due to [(2)-(No such file or directory)].
2018/10/17 14:25:20 ossec-logcollector: ERROR: (1103): Could not open file ‘/var/log/secure’ due to [(2)-(No such file or directory)].
2018/10/17 14:26:08 ossec-agentd: WARNING: Agent buffer at 90 %.
2018/10/17 14:26:08 ossec-agentd: WARNING: Agent buffer is full: Events may be lost.
2018/10/17 14:28:18 ossec-logcollector: ERROR: (1103): Could not open file ‘/var/log/messages’ due to [(2)-(No such file or directory)].
2018/10/17 14:28:18 ossec-logcollector: ERROR: (1103): Could not open file ‘/var/log/secure’ due to [(2)-(No such file or directory)].
2018/10/17 14:29:06 ossec-agentd: WARNING: Agent buffer at 90 %.
2018/10/17 14:29:06 ossec-agentd: WARNING: Agent buffer is full: Events may be lost.
Debugging json alerts for specific agent 13
Ok, let’s debug your agent events using logall_json in the Wazuh manager instance.
Login using SSH into the Wazuh manager instance and edit the ossec.conf file.
- Edit the file /var/ossec/etc/ossec.conf and look for the <global> section, then enable <logall_json>
<logall_json>yes</logall_json>
2. Restart the Wazuh manager
# systemctl restart wazuh-manager
3. Login using SSH into the Wazuhagent(13) instance, restart it and tail -f until it shows you the warning message:
# systemctl restart wazuh-agent# tail -f /var/ossec/logs/ossec.log | grep WARNING
4. Once you see ossec-agentd: WARNING: Agent buffer at 90 %. in the Wazuh agent logs,
then switch your CLI to the Wazuh manager instance again and
the next file we want to tail is from your Wazuh manager:
tail –f /var/ossec/logs/archives/archives.json
5. Now we can take a look into events in order to clarify what is flooding the agent “013”.
Once you have the log is seen, you can disable logall_json and restart the Wazuh manager.
6.
Log from tail –f /var/ossec/logs/archives/archives.json (wazuh-manager)
{“timestamp”:”2018-10-17T18:06:17.33+0100″,”rule”:{“level”:7,”description”:”Host-based anomaly detection event (rootcheck).”,”id”:”510″,”firedtimes”:3352,”mail”:false,”groups”:[“ossec”,”rootcheck”],”gdpr”:[“IV_35.7.d”]},”agent”:{“id”:”013″,”na
me”:”waz03“,”ip”:”10.79.244.143″},”manager”:{“name”:”waz01“},”id”:”1539795977.2752038221″,“full_log”:”File ‘/var/lib/kubelet/pods/2ff462ce-7233-11e8-8282-005056b518e6/containers/install-cni/e26aa5b1’ is owned by root and has written permissions to anyone.”,”decoder“:{“name”:”rootcheck“},”data”:{“title”:”File is owned by root and has written permissions to anyone.”,”file”:”/var/lib/kubelet/pods/2ff462ce-7233-11e8-8282-005056b518e6/containers/install-cni/e26aa5b1″},”location”:”rootcheck”}
{“timestamp”:”2018-10-17T18:06:17.35+0100″,”rule”:{“level”:7,”description”:”Host-based anomaly detection event (rootcheck).”,”id”:”510″,”firedtimes”:3353,”mail”:false,”groups”:[“ossec”,”rootcheck”],”gdpr”:[“IV_35.7.d”]},”agent”:{“id”:”013″,”name”:”waz03“,”ip”:”10.79.244.143″},”manager”:{“name”:”waz01“},”id”:”1539795977.2752038739″,”full_log”:”File ‘/var/lib/kubelet/pods/2ff462ce-7233-11e8-8282-005056b518e6/containers/install-cni/12cb9011’ is owned by root and has written permissions to anyone.”,”decoder“:{“name”:”rootcheck“},”data”:{“title”:”File is owned by root and has written permissions to anyone.”,”file”:”/var/lib/kubelet/pods/2ff462ce-7233-11e8-8282-005056b518e6/containers/install-cni/12cb9011″},”location”:”rootcheck”}
{“timestamp”:”2018-10-17T18:06:17.37+0100″,”rule”:{“level”:7,”description”:”Host-based anomaly detection event (rootcheck).”,”id”:”510″,”firedtimes”:3354,”mail”:false,”groups”:[“ossec”,”rootcheck”],”gdpr”:[“IV_35.7.d”]},”agent”:{“id”:”013″,”name”:”waz03“,”ip”:”10.79.244.143″},”manager”:{“name”:”waz01“},”id”:”1539795977.2752039257″,”full_log”:”File ‘/var/lib/kubelet/pods/2ff462ce-7233-11e8-8282-005056b518e6/containers/install-cni/4a930107’ is owned by root and has written permissions to anyone.”,”decoder“:{“name”:”rootcheck“},”data”:{“title”:”File is owned by root and has written permissions to anyone.”,”file”:”/var/lib/kubelet/pods/2ff462ce-7233-11e8-8282-005056b518e6/containers/install-cni/4a930107″},”location”:”rootcheck”}
{“timestamp”:”2018-10-17T18:06:17.40+0100″,”rule“:{“level”:7,”description”:”Host-based anomaly detection event
From the above log we can see that kubernetes is sending a lot of events to the agent causing the buffer to fill up. To solve this we particular issue from happening in future. We can disable this at the client level or the global level.
Here you can see the number of events from rootcheck in your archives.json:
cat archives.json grep rootcheck wc –l489
Here you can see the number of events from rootcheck and rule 510 in thearchives.json:
cat archives.json grep rootcheck grep 510 wc –l489
Here you can see the number of events from rootcheck and rule 510 and including “/var/lib/kubelet/pods/“ in your archives.json:
cat archives.json grep rootcheck grep 510 grep /var/lib/kubelet/pods/ wc –l489
So we have two options:
Option 1. Edit the ossec.conf from your Wazuh agent “013”. (This is the one I did)
– Login using SSH into the Wazuh agent “013” instance.
– Edit the file /var/ossec/etc/ossec.conf, and look for the rootcheck block, then put a <ignore> block for that directory.
<rootcheck>…<ignore>/var/lib/kubelet</ignore>…</rootcheck>
Restart the Wazuh agent “013”
# systemctl restart wazuh-agent
Option 2. Check in which group is your agent and edit its centralized configuration.
– Login using SSH into the Wazuh manager instance.
– Check the group where is agent “013”
# /var/ossec/bin/agent_groups -s –i 013
– Note down the group, example: default
– Edit the file under /var/ossec/etc/shared/default/agent.conf (replace default by the real group name, it could be different from my example),
then add the rootcheck ignore inside the <agent_config> block, example:
<agent_config> <!– Shared agent configuration here –> <rootcheck> <ignore>/var/lib/kuberlet</ignore> </rootcheck></agent_config>
– Restart the Wazuh manager
# systemctl restart wazuh-manager
– Restart the agent on client as well
# systemctl restart wazuh–agent
The solution #1 takes effect immediately.
The solution #2 will push the new configuration from the Wazuh manager to the Wazuh agent, once the agent receives it,
it auto restarts itself automatically and then it applies the new configuration. It could take a bit more time than solution #1.
On a side note, you can take a look at this useful link about the agent flooding:
The above link talks about how to prevent from being flooded.
Now the agent should show correctly in the 15min time range. If a bunch of client had the issue then you need to use ansible to send out a agent restart on all clients or setup a cron on all the machines to restart the agent every 24 hours.
Discover on the agent should also show logs
Ansible adhoc command or playbook.
Example:
- ansible –i hosts–linuxdevelopment -a “sudo systemctl restart wazuh-agent” –vault-password-file /etc/ansible/vaultpw.txt -u ansible_nickt -k -K