
Author: admin
Deploying SLURM with Slinky: Bridging HPC and Kubernetes for Container Workloads
High-Performance Computing (HPC) environments are evolving rapidly, and the need to integrate traditional HPC job schedulers with modern containerized infrastructure has never been greater. Enter Slinky – SchedMD’s official project that seamlessly integrates SLURM with Kubernetes, enabling you to run containerized workloads through SLURM’s powerful scheduling capabilities.
In this comprehensive guide, we’ll walk through deploying SLURM using Slinky with Docker container support, bringing together the best of both HPC and cloud-native worlds.
What is Slinky?
Slinky is a toolbox of components developed by SchedMD (the creators of SLURM) to integrate SLURM with Kubernetes. Unlike traditional approaches that force users to change how they interact with SLURM, Slinky preserves the familiar SLURM user experience while adding powerful container orchestration capabilities.
Key Components:
- Slurm Operator – Manages SLURM clusters as Kubernetes resources
- Container Support – Native OCI container execution through SLURM
- Auto-scaling – Dynamic resource allocation based on workload demand
- Slurm Bridge – Converged workload scheduling and prioritization
Prerequisites and Environment Setup
Before we begin, ensure you have a working Kubernetes cluster with the following requirements:
- Kubernetes 1.24+ cluster with admin access
- Helm 3.x installed
- kubectl configured and connected to your cluster
- Sufficient cluster resources (minimum 4 CPU cores, 8GB RAM)
Step 1: Install Required Dependencies
Slinky requires several prerequisite components. Let’s install them using Helm:
# Add required Helm repositories
helm repo add prometheus-community https://prometheus-community.github.io/helm-charts
helm repo add metrics-server https://kubernetes-sigs.github.io/metrics-server/
helm repo add bitnami https://charts.bitnami.com/bitnami
helm repo add jetstack https://charts.jetstack.io
helm repo update

# Install cert-manager for TLS certificate management
helm install cert-manager jetstack/cert-manager \
  --namespace cert-manager --create-namespace --set crds.enabled=true

# Install Prometheus stack for monitoring
helm install prometheus prometheus-community/kube-prometheus-stack \
  --namespace prometheus --create-namespace --set installCRDs=true
Wait for all pods to be running before proceeding:
# Verify installations
kubectl get pods -n cert-manager
kubectl get pods -n prometheus
Step 2: Deploy the Slinky SLURM Operator
Now we’ll install the core Slinky operator that manages SLURM clusters within Kubernetes:
# Download the default configuration
curl -L https://raw.githubusercontent.com/SlinkyProject/slurm-operator/refs/tags/v0.2.1/helm/slurm-operator/values.yaml \
  -o values-operator.yaml

# Install the Slurm Operator
helm install slurm-operator oci://ghcr.io/slinkyproject/charts/slurm-operator \
  --values=values-operator.yaml --version=0.2.1 \
  --namespace=slinky --create-namespace
Verify the operator is running:
kubectl get pods -n slinky
# Expected output: slurm-operator pod in Running status
Step 3: Configure Container Support
Before deploying the SLURM cluster, let’s configure it for container support. Download and modify the SLURM configuration:
# Download SLURM cluster configuration
curl -L https://raw.githubusercontent.com/SlinkyProject/slurm-operator/refs/tags/v0.2.1/helm/slurm/values.yaml \
  -o values-slurm.yaml
Edit values-slurm.yaml to enable container support:
# Add container configuration to values-slurm.yaml
controller:
  config:
    slurm.conf: |
      # Basic cluster configuration
      ClusterName=slinky-cluster
      ControlMachine=slurm-controller-0

      # Enable container support
      ProctrackType=proctrack/cgroup
      TaskPlugin=task/cgroup,task/affinity
      PluginDir=/usr/lib64/slurm

      # Authentication
      AuthType=auth/munge

      # Node configuration
      NodeName=slurm-compute-debug-[0-9] CPUs=4 Boards=1 SocketsPerBoard=1 CoresPerSocket=2 ThreadsPerCore=2 State=UNKNOWN
      PartitionName=debug Nodes=slurm-compute-debug-[0-9] Default=YES MaxTime=INFINITE State=UP

      # Accounting
      AccountingStorageType=accounting_storage/slurmdbd
      AccountingStorageHost=slurm-accounting-0

compute:
  config:
    oci.conf: |
      # OCI container runtime configuration
      RunTimeQuery="runc --version"
      RunTimeCreate="runc create %n.%u %b"
      RunTimeStart="runc start %n.%u"
      RunTimeKill="runc kill --all %n.%u SIGTERM"
      RunTimeDelete="runc delete --force %n.%u"

      # Security and patterns
      OCIPattern="^[a-zA-Z0-9][a-zA-Z0-9_.-]*$"
      CreateEnvFile="/tmp/slurm-oci-create-env-%j.%u.%t.tmp"
      RunTimeEnvExclude="HOME,PATH,LD_LIBRARY_PATH"
Step 4: Deploy the SLURM Cluster
Now deploy the SLURM cluster with container support enabled:
# Deploy SLURM cluster
helm install slurm oci://ghcr.io/slinkyproject/charts/slurm \
  --values=values-slurm.yaml --version=0.2.1 \
  --namespace=slurm --create-namespace
Monitor the deployment progress:
# Watch pods come online
kubectl get pods -n slurm -w

# Expected pods:
# slurm-accounting-0      1/1     Running
# slurm-compute-debug-0   1/1     Running
# slurm-controller-0      2/2     Running
# slurm-exporter-xxx      1/1     Running
# slurm-login-xxx         1/1     Running
# slurm-mariadb-0         1/1     Running
# slurm-restapi-xxx       1/1     Running
Step 5: Access and Test the SLURM Cluster
Once all pods are running, connect to the SLURM login node:
# Get login node IP address
SLURM_LOGIN_IP="$(kubectl get services -n slurm -l app.kubernetes.io/instance=slurm,app.kubernetes.io/name=login -o jsonpath="{.items[0].status.loadBalancer.ingress[0].ip}")"

# SSH to login node (default port 2222)
ssh -p 2222 root@${SLURM_LOGIN_IP}
If you don’t have LoadBalancer support, use port-forwarding:
# Port forward to login pod
kubectl port-forward -n slurm service/slurm-login 2222:2222

# Connect via localhost
ssh -p 2222 root@localhost
Step 6: Running Container Jobs
Now for the exciting part – running containerized workloads through SLURM!
Basic Container Job
Create a simple container job script:
# Create a container job script
cat > container_test.sh << EOF
#!/bin/bash
#SBATCH --job-name=container-hello
#SBATCH --ntasks=1
#SBATCH --time=00:05:00
#SBATCH --container=docker://alpine:latest

echo "Hello from containerized SLURM job!"
echo "Running on node: \$(hostname)"
echo "Job ID: \$SLURM_JOB_ID"
echo "Container OS: \$(cat /etc/os-release | grep PRETTY_NAME)"
EOF

# Submit the job
sbatch container_test.sh

# Check job status
squeue
Interactive Container Sessions
Run containers interactively using srun:
# Interactive Ubuntu container
srun --container=docker://ubuntu:20.04 /bin/bash

# Quick command in Alpine container
srun --container=docker://alpine:latest /bin/sh -c "echo 'Container execution successful'; uname -a"

# Python data science container
srun --container=docker://python:3.9 python -c "import sys; print(f'Python {sys.version} running in container')"
GPU Container Jobs
If your cluster has GPU nodes, you can run GPU-accelerated containers:
# GPU container job
cat > gpu_container.sh << EOF
#!/bin/bash
#SBATCH --job-name=gpu-test
#SBATCH --gres=gpu:1
#SBATCH --container=docker://nvidia/cuda:11.0-runtime-ubuntu20.04

nvidia-smi
nvcc --version
EOF

sbatch gpu_container.sh
MPI Container Jobs
Run parallel MPI applications in containers:
# MPI container job
cat > mpi_container.sh << EOF
#!/bin/bash
#SBATCH --job-name=mpi-test
#SBATCH --ntasks=4
#SBATCH --container=docker://mpirun/openmpi:latest

mpirun -np \$SLURM_NTASKS hostname
EOF

sbatch mpi_container.sh
Step 7: Monitoring and Auto-scaling
Monitor Cluster Health
Check SLURM cluster status from the login node:
# Check node status
sinfo

# Check running jobs
squeue

# Check cluster configuration
scontrol show config | grep -i container
Kubernetes Monitoring
Monitor from the Kubernetes side:
# Check pod resource usage
kubectl top pods -n slurm

# View SLURM operator logs
kubectl logs -n slinky deployment/slurm-operator

# Check custom resources
kubectl get clusters.slinky.slurm.net -n slurm
kubectl get nodesets.slinky.slurm.net -n slurm
Configure Auto-scaling
Enable auto-scaling by updating your values file:
# Add to values-slurm.yaml
compute:
  autoscaling:
    enabled: true
    minReplicas: 1
    maxReplicas: 10
    targetCPUUtilizationPercentage: 70

# Update the deployment
helm upgrade slurm oci://ghcr.io/slinkyproject/charts/slurm \
  --values=values-slurm.yaml --version=0.2.1 \
  --namespace=slurm
Advanced Configuration Tips
Custom Container Runtimes
Configure alternative container runtimes like Podman:
# Alternative oci.conf for Podman
compute:
  config:
    oci.conf: |
      # Podman runtime configuration
      RunTimeQuery="podman --version"
      RunTimeRun="podman run --rm --cgroups=disabled --name=%n.%u %m %c"

      # Security settings
      OCIPattern="^[a-zA-Z0-9][a-zA-Z0-9_.-]*$"
      CreateEnvFile="/tmp/slurm-oci-create-env-%j.%u.%t.tmp"
Persistent Storage for Containers
Configure persistent volumes for containerized jobs:
# Add persistent volume support
compute:
  persistence:
    enabled: true
    storageClass: "fast-ssd"
    size: "100Gi"
    mountPath: "/shared"
Troubleshooting Common Issues
Container Runtime Not Found
If you encounter container runtime errors:
# Check runtime availability on compute nodes
kubectl exec -n slurm slurm-compute-debug-0 -- which runc
kubectl exec -n slurm slurm-compute-debug-0 -- runc --version

# Verify oci.conf is properly mounted
kubectl exec -n slurm slurm-compute-debug-0 -- cat /etc/slurm/oci.conf
Job Submission Failures
Debug job submission issues:
# Check SLURM logs
kubectl logs -n slurm slurm-controller-0 -c slurmctld

# Verify container image availability
srun --container=docker://alpine:latest /bin/echo "Container test"

# Check job details
scontrol show job
Conclusion
Slinky represents a significant step forward in bridging the gap between traditional HPC and modern cloud-native infrastructure. By deploying SLURM with Slinky, you get:
- Unified Infrastructure - Run both SLURM and Kubernetes workloads on the same cluster
- Container Support - Native OCI container execution through familiar SLURM commands
- Auto-scaling - Dynamic resource allocation based on workload demand
- Cloud Native - Standard Kubernetes deployment and management patterns
- Preserved Workflow - Keep existing SLURM scripts and user experience
This powerful combination enables organizations to modernize their HPC infrastructure while maintaining the robust scheduling and resource management capabilities that SLURM is known for. Whether you're running AI/ML training workloads, scientific simulations, or data processing pipelines, Slinky provides the flexibility to containerize your applications without sacrificing the control and efficiency of SLURM.
Ready to get started? The Slinky project is open-source and available on GitHub. Visit the SlinkyProject GitHub organization for the latest documentation and releases.
How to Deploy a Node.js App to Azure App Service with CI/CD
Option A: Code-Based Deployment (Recommended for Most Users)
If you don’t need a custom runtime or container, Azure’s built-in code deployment option is the fastest and easiest way to host production-ready Node.js applications. Azure provides a managed environment with runtime support for Node.js, and you can automate everything using Azure DevOps.
This option is ideal for most production use cases that:
- Use standard versions of Node.js (or Python, .NET, PHP)
- Don’t require custom OS packages or NGINX proxies
- Want quick setup and managed scaling
This section covers everything you need to deploy your Node.js app using Azure’s built-in runtime and set it up for CI/CD in Azure DevOps.
Step 0: Prerequisites and Permissions
Before starting, make sure you have the following:
- Azure Subscription with Contributor access
- Azure CLI installed and authenticated (
az login) - Azure DevOps Organization & Project
- Code repository in Azure Repos or GitHub (we’ll use Azure Repos)
- A user with the following roles:
- Contributor on the Azure resource group
- Project Administrator or Build Administrator in Azure DevOps (to create pipelines and service connections)
Step 1: Create an Azure Resource Group
az group create --name prod-rg --location eastusStep 2: Choose Your Deployment Model
There are two main ways to deploy to Azure App Service:
- Code-based: Azure manages the runtime (Node.js, Python, etc.)
- Docker-based: You provide a custom Docker image
Option A: Code-Based App Service Plan
az appservice plan create \
  --name prod-app-plan \
  --resource-group prod-rg \
  --sku P1V2 \
  --is-linux
az appservice plan create: Command to create a new App Service Plan (defines compute resources)--name prod-app-plan: The name of the service plan to create--resource-group prod-rg: The name of the resource group where the plan will reside--sku P1V2: The pricing tier (Premium V2, small instance). Includes autoscaling, staging slots, etc.--is-linux: Specifies the operating system for the app as Linux (required for Node.js apps)
Create Web App with Built-In Node Runtime
az webapp create \
  --name my-prod-node-app \
  --resource-group prod-rg \
  --plan prod-app-plan \
  --runtime "NODE|18-lts"
az webapp create: Creates the actual web app that will host your code--name my-prod-node-app: The globally unique name of your app (will be part of the public URL)--resource-group prod-rg: Assigns the app to the specified resource group--plan prod-app-plan: Binds the app to the previously created compute plan--runtime "NODE|18-lts": Specifies the Node.js runtime version (Node 18, LTS channel)
Option B: Docker-Based App Service Plan
az appservice plan create \
  --name prod-docker-plan \
  --resource-group prod-rg \
  --sku P1V2 \
--is-linux- Same as Option A — this creates a Linux-based Premium plan
- You can reuse this compute plan for one or more container-based apps
Create Web App Using Custom Docker Image
az webapp create \
  --name my-docker-app \
  --resource-group prod-rg \
  --plan prod-docker-plan \
  --deployment-container-image-name myregistry.azurecr.io/myapp:latest
--name my-docker-app: A unique name for your app--resource-group prod-rg: Associates this web app with your resource group--plan prod-docker-plan: Assigns the app to your App Service Plan--deployment-container-image-name: Specifies the full path to your Docker image (from ACR or Docker Hub)
Use this if you’re building a containerized app and want full control of the runtime environment. Make sure your image is accessible in Azure Container Registry or Docker Hub.
Step 3: Prepare Your Azure DevOps Project
- Navigate to https://dev.azure.com
- Create a new Project (e.g.,
ProdWebApp) - Go to Repos and push your Node.js code:
git remote add origin https://dev.azure.com/<org>/<project>/_git/my-prod-node-app
git push -u origin main
Step 4: Create a Service Connection
- In DevOps, go to Project Settings > Service connections
- Click New service connection > Azure Resource Manager
- Choose Service principal (automatic)
- Select the correct subscription and resource group
- Name it something like
AzureProdConnection
Step 5: Create the CI/CD Pipeline
Add the following to your repository root as .azure-pipelines.yml.
Code-Based YAML Example
trigger:
  branches:
    include:
      - main

pool:
  vmImage: 'ubuntu-latest'

stages:
- stage: Build
  jobs:
  - job: BuildApp
    steps:
    - task: NodeTool@0
      inputs:
        versionSpec: '18.x'

    - script: |
        npm install
        npm run build
      displayName: 'Install and Build'

    - task: ArchiveFiles@2
      inputs:
        rootFolderOrFile: '$(System.DefaultWorkingDirectory)'
        archiveFile: '$(Build.ArtifactStagingDirectory)/app.zip'
        includeRootFolder: false

    - task: PublishBuildArtifacts@1
      inputs:
        PathtoPublish: '$(Build.ArtifactStagingDirectory)'
        ArtifactName: 'drop'

- stage: Deploy
  dependsOn: Build
  jobs:
  - deployment: DeployWebApp
    environment: 'production'
    strategy:
      runOnce:
        deploy:
          steps:
          - task: AzureWebApp@1
            inputs:
              azureSubscription: 'AzureProdConnection'
              appName: 'my-prod-node-app'
              package: '$(Pipeline.Workspace)/drop/app.zip'
Docker-Based YAML Example
trigger:
  branches:
    include:
      - main

pool:
  vmImage: 'ubuntu-latest'

stages:
- stage: Deploy
  jobs:
  - deployment: DeployContainer
    environment: 'production'
    strategy:
      runOnce:
        deploy:
          steps:
          - task: AzureWebAppContainer@1
            inputs:
              azureSubscription: 'AzureProdConnection'
              appName: 'my-docker-app'
              containers: 'myregistry.azurecr.io/myapp:latest'
Step 6: Configure Pipeline and Approvals
- Go to Pipelines > Pipelines > New
- Select Azure Repos Git, choose your repo, and point to the YAML file
- Click Run Pipeline
To add manual approvals:
- Go to Pipelines > Environments
- Create a new environment named
production - Link the deploy stage to this environment in your YAML:
environment: 'production'- Enable approval and checks for production safety
Step 7: Store Secrets (Optional but Recommended)
- Go to Pipelines > Library
- Create a new Variable Group (e.g.,
ProdSecrets) - Add variables like
DB_PASSWORD,API_KEY, and mark them as secret - Reference them in pipeline YAML:
variables:
  - group: 'ProdSecrets'
Troubleshooting Tips
| Problem | Solution |
|---|---|
| Resource group not found | Make sure you created it with az group create |
| Runtime version not supported | Run az webapp list-runtimes --os linux to see current options |
| Pipeline can’t deploy | Check if the service connection has Contributor role on the resource group |
| Build fails | Make sure you have a valid package.json and build script |
Summary
By the end of this process, you will have:
- A production-grade Node.js app running on Azure App Service
- A scalable App Service Plan using Linux and Premium V2 resources
- A secure CI/CD pipeline that automatically builds and deploys from Azure Repos
- Manual approval gates and secrets management for enhanced safety
- The option to deploy using either Azure-managed runtimes or fully custom Docker containers
This setup is ideal for fast-moving
How to Deploy a Custom Rocky Linux Image in Azure with cloud-init
Need a clean, hardened Rocky Linux image in Azure — ready to go with your tools and configs? Here’s how to use Packer to build a Rocky image and then deploy it with cloud-init using Azure CLI.
Step 0: Install Azure CLI
Before deploying anything, make sure you have Azure CLI installed.
Linux/macOS:
curl -sL https://aka.ms/InstallAzureCLIDeb | sudo bashWindows:
Download and install from https://aka.ms/installazurecli
Login:
az loginThis opens a browser window for authentication. Once done, you’re ready to deploy.
Step 1: Build a Custom Image with Packer
Create a Packer template with Azure as the target and make sure cloud-init is installed during provisioning.
Packer Template Example (rocky-azure.pkr.hcl):
source "azure-arm" "rocky" {
  client_id       = var.client_id
  client_secret   = var.client_secret
  tenant_id       = var.tenant_id
  subscription_id = var.subscription_id

  managed_image_resource_group_name = "packer-images"
  managed_image_name                = "rocky-image"
  location                          = "East US"
  os_type                           = "Linux"
  image_publisher                   = "OpenLogic"
  image_offer                       = "CentOS"
  image_sku                         = "8_2"
  vm_size                           = "Standard_B1s"
  build_resource_group_name         = "packer-temp"
}

build {
  sources = ["source.azure-arm.rocky"]

  provisioner "shell" {
    inline = [
      "dnf install -y cloud-init",
      "systemctl enable cloud-init"
    ]
  }
}
Variables File (variables.pkrvars.hcl):
client_id       = "xxxxxxxx-xxxx-xxxx-xxxx-xxxxxxxxxxxx"
client_secret   = "your-secret"
tenant_id       = "your-tenant-id"
subscription_id = "your-subscription-id"
Build the Image:
packer init .
packer build -var-file=variables.pkrvars.hcl .
Step 2: Prepare a Cloud-init Script
This will run the first time the VM boots and set things up.
cloud-init.yaml:
#cloud-config
hostname: rocky-demo
users:
  - name: devops
    sudo: ALL=(ALL) NOPASSWD:ALL
    groups: users, admin
    shell: /bin/bash
    ssh_authorized_keys:
      - ssh-rsa AAAA...your_key_here...

runcmd:
  - yum update -y
  - echo 'Cloud-init completed!' > /etc/motd
Step 3: Deploy the VM in Azure
Use the Azure CLI to deploy a VM from the managed image and inject the cloud-init file.
az vm create \
  --resource-group my-rg \
  --name rocky-vm \
  --image /subscriptions/<SUB_ID>/resourceGroups/packer-images/providers/Microsoft.Compute/images/rocky-image \
  --admin-username azureuser \
  --generate-ssh-keys \
  --custom-data cloud-init.yaml
Step 4: Verify Cloud-init Ran
ssh azureuser@<public-ip>
cat /etc/motd
You should see:
Cloud-init completed!Recap
- Install Azure CLI and authenticate with
az login - Packer creates a reusable Rocky image with
cloud-initpreinstalled - Cloud-init configures the VM at first boot using a YAML script
- Azure CLI deploys the VM and injects custom setup
By combining Packer and cloud-init, you ensure your Azure VMs are fast, consistent, and ready from the moment they boot.
Automate Rocky Linux Image Creation in Azure Using Packer
Spinning up clean, custom Rocky Linux VMs in Azure doesn’t have to involve manual configuration or portal clicks. With HashiCorp Packer, you can create, configure, and publish VM images to your Azure subscription automatically.
What You’ll Need
- Packer installed
- Azure CLI (
az login) - Azure subscription & resource group
- Azure Service Principal credentials
Step 1: Install Azure CLI
You need the Azure CLI to authenticate and manage resources.
On Linux/macOS:
curl -sL https://aka.ms/InstallAzureCLIDeb | sudo bashOn Windows:
Download and install from https://aka.ms/installazurecli
Step 2: Login to Azure
az loginThis will open a browser window for you to authenticate your account.
Step 3: Set the Default Subscription (if you have more than one)
az account set --subscription "SUBSCRIPTION_NAME_OR_ID"Step 4: Create a Resource Group for Images
az group create --name packer-images --location eastusStep 5: Create a Service Principal for Packer
az ad sp create-for-rbac \
  --role="Contributor" \
  --scopes="/subscriptions/<your-subscription-id>" \
  --name "packer-service-principal"
This will return the client_id, client_secret, tenant_id, and subscription_id needed for your variables file.
Step 6: Write the Packer Template (rocky-azure.pkr.hcl)
variable "client_id" {}
variable "client_secret" {}
variable "tenant_id" {}
variable "subscription_id" {}

source "azure-arm" "rocky" {
  client_id       = var.client_id
  client_secret   = var.client_secret
  tenant_id       = var.tenant_id
  subscription_id = var.subscription_id

  managed_image_resource_group_name = "packer-images"
  managed_image_name                = "rocky-image"

  os_type             = "Linux"
  image_publisher     = "OpenLogic"
  image_offer         = "CentOS"
  image_sku           = "8_2"
  location            = "East US"
  vm_size             = "Standard_B1s"

  capture_container_name    = "images"
  capture_name_prefix       = "rocky-linux"
  build_resource_group_name = "packer-temp"
}

build {
  sources = ["source.azure-arm.rocky"]

  provisioner "shell" {
    inline = [
      "sudo dnf update -y",
      "sudo dnf install epel-release -y"
    ]
  }
}
Step 7: Create a Variables File (variables.pkrvars.hcl)
client_id       = "xxxxxxxx-xxxx-xxxx-xxxx-xxxxxxxxxxxx"
client_secret   = "your-secret"
tenant_id       = "your-tenant-id"
subscription_id = "your-subscription-id"
Step 8: Run the Build
packer init .
packer build -var-file=variables.pkrvars.hcl .
Result
Your new custom Rocky Linux image will appear under your Azure resource group inside the Images section. From there, you can deploy it via the Azure Portal, CLI, Terraform, or ARM templates.
This process makes your infrastructure repeatable, versioned, and cloud-native. Use it to standardize dev environments or bake in security hardening from the start.
Automating Rocky Linux VM Creation with Packer + VirtualBox
If you’ve ever needed to spin up a clean, minimal Linux VM for testing or local automation — and got tired of clicking through the VirtualBox GUI — this guide is for you.
We’ll walk through how to use HashiCorp Packer and VirtualBox to automatically create a Rocky Linux 8.10 image, ready to boot and use — no Vagrant, no fluff.
What You’ll Need
- Packer installed
- VirtualBox installed
- Rocky Linux 8.10 ISO link (we use minimal)
- Basic understanding of Linux + VirtualBox
Project Structure
packer-rocky/
├── http/
│   └── ks.cfg       # Kickstart file for unattended install
├── rocky.pkr.hcl    # Main Packer config
Step 1: Create the Kickstart File (http/ks.cfg)
install
cdrom
lang en_US.UTF-8
keyboard us
network --bootproto=dhcp
rootpw packer
firewall --disabled
selinux --permissive
timezone UTC
bootloader --location=mbr
text
skipx
zerombr

# Partition disk
clearpart --all --initlabel
part /boot --fstype="xfs" --size=1024
part pv.01 --fstype="lvmpv" --grow
volgroup vg0 pv.01
logvol / --vgname=vg0 --fstype="xfs" --size=10240 --name=root
logvol swap --vgname=vg0 --size=4096 --name=swap

reboot

%packages --ignoremissing
@core
@base
%end

%post
# Post-install steps can be added here
%end
Step 2: Create the Packer HCL Template (rocky.pkr.hcl)
packer {
required_plugins {
virtualbox = {
version = ">= 1.0.5"
source = "github.com/hashicorp/virtualbox"
}
}
}
source "virtualbox-iso" "rocky" {
iso_url = "https://download.rockylinux.org/pub/rocky/8/isos/x86_64/Rocky-8.10-x86_64-minimal.iso"
iso_checksum = "2c735d3b0de921bd671a0e2d08461e3593ac84f64cdaef32e3ed56ba01f74f4b"
guest_os_type = "RedHat_64"
memory = 2048
cpus = 2
disk_size = 40000
vm_name = "rocky-8"
headless = false
guest_additions_mode = "disable"
boot_command = [" inst.text inst.ks=http://{{ .HTTPIP }}:{{ .HTTPPort }}/ks.cfg"]
http_directory = "http"
ssh_username = "root"
ssh_password = "packer"
ssh_timeout = "20m"
shutdown_command = "shutdown -P now"
vboxmanage = [
["modifyvm", "{{.Name}}", "--vram", "32"],
["modifyvm", "{{.Name}}", "--vrde", "off"],
["modifyvm", "{{.Name}}", "--ioapic", "off"],
["modifyvm", "{{.Name}}", "--pae", "off"],
["modifyvm", "{{.Name}}", "--nested-hw-virt", "on"]
]
}
build {
sources = ["source.virtualbox-iso.rocky"]
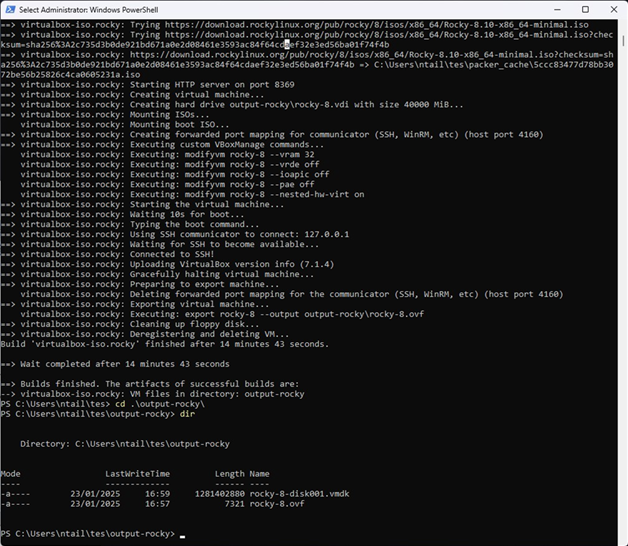
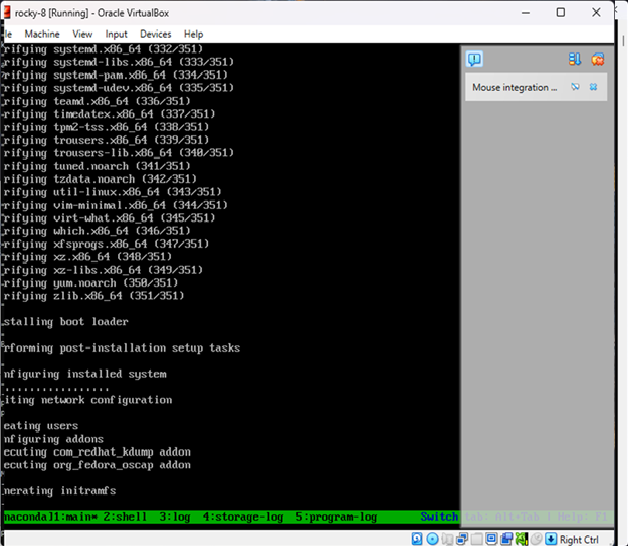
}Step 3: Run the Build
cd packer-rocky
packer init .
packer build .
Packer will:
- Download and boot the ISO in VirtualBox
- Serve the ks.cfg file over HTTP
- Automatically install Rocky Linux
- Power off the machine once complete
Result
You now have a fully installed Rocky Linux 8.10 image in VirtualBox — no manual setup required.
How to Deploy Kubernetes on AWS the Scalable Way
Kubernetes has become the de facto standard for orchestrating containerized workloads—but deploying it correctly on AWS requires more than just spinning up an EKS cluster. You need to think about scalability, cost-efficiency, security, and high availability from day one.
In this guide, we’ll walk you through how to deploy a scalable, production-grade Kubernetes environment on AWS—step by step.
Why Kubernetes on AWS?
Amazon Web Services offers powerful tools to run Kubernetes at scale, including:
- Amazon EKS – Fully managed control plane
- EC2 Auto Scaling Groups – Dynamic compute scaling
- Elastic Load Balancer (ELB) – Handles incoming traffic
- IAM Roles for Service Accounts – Fine-grained access control
- Fargate (Optional) – Run pods without managing servers
Step-by-Step Deployment Plan
1. Plan the Architecture
Your Kubernetes architecture should be:
- Highly Available (Multi-AZ)
- Scalable (Auto-scaling groups)
- Secure (Private networking, IAM roles)
- Observable (Monitoring, logging)
+---------------------+
|   Route 53 / ALB    |
+----------+----------+
           |
   +-------v-------+
   |  EKS Control   |
   |    Plane       |  <- Managed by AWS
   +-------+--------+
           |
+----------v----------+
|   EC2 Worker Nodes   |  <- Auto-scaling
|  (in Private Subnet) |
+----------+-----------+
           |
   +-------v--------+
   |  Kubernetes     |
   |  Workloads      |
   +-----------------+
2. Provision Infrastructure with IaC (Terraform)
Use Terraform to define your VPC, subnets, security groups, and EKS cluster:
module "eks" {
  source          = "terraform-aws-modules/eks/aws"
  cluster_name    = "my-cluster"
  cluster_version = "1.29"
  subnets         = module.vpc.private_subnets
  vpc_id          = module.vpc.vpc_id
  manage_aws_auth = true

  node_groups = {
    default = {
      desired_capacity = 3
      max_capacity     = 6
      min_capacity     = 1
      instance_type    = "t3.medium"
    }
  }
}
Security Tip: Keep worker nodes in private subnets and expose only your load balancer to the public internet.
3. Set Up Cluster Autoscaler
Install the Kubernetes Cluster Autoscaler to automatically scale your EC2 nodes:
kubectl apply -f cluster-autoscaler-autodiscover.yamlEnsure the autoscaler has IAM permissions via IRSA (IAM Roles for Service Accounts).
4. Use Horizontal Pod Autoscaler
Use HPA to scale pods based on resource usage:
apiVersion: autoscaling/v2
kind: HorizontalPodAutoscaler
metadata:
  name: myapp-hpa
spec:
  scaleTargetRef:
    apiVersion: apps/v1
    kind: Deployment
    name: myapp
  minReplicas: 2
  maxReplicas: 10
  metrics:
  - type: Resource
    resource:
      name: cpu
      target:
        type: Utilization
        averageUtilization: 70
5. Implement CI/CD Pipelines
Use tools like Argo CD, Flux, or GitHub Actions:
- name: Deploy to EKS
  uses: aws-actions/amazon-eks-deploy@v1
  with:
    cluster-name: my-cluster
    kubectl-version: '1.29'
6. Set Up Observability
Install:
- Prometheus + Grafana for metrics
- Fluent Bit or Loki for logging
- Kube-State-Metrics for cluster state
- AWS CloudTrail and GuardDuty for security monitoring
7. Optimize Costs
- Use Spot Instances with on-demand fallback
- Use EC2 Mixed Instance Policies
- Try Graviton (ARM) nodes for better cost-performance ratio
Bonus: Fargate Profiles for Microservices
For small or bursty workloads, use AWS Fargate to run pods serverlessly:
eksctl create fargateprofile \
  --cluster my-cluster \
  --name fp-default \
  --namespace default
Recap Checklist
- Multi-AZ VPC with private subnets
- Terraform-managed EKS cluster
- Cluster and pod auto-scaling enabled
- CI/CD pipeline in place
- Observability stack (metrics/logs/security)
- Spot instances or Fargate to save costs
Deploying Kubernetes on AWS at scale doesn’t have to be complex—but it does need a solid foundation. Use managed services where possible, automate everything, and focus on observability and security from the start.
If you’re looking for a production-grade, scalable deployment, Terraform + EKS + autoscaling is your winning combo.
Fixing Read-Only Mode on eLux Thin Clients
Fixing Read-Only Mode on eLux Thin Clients
If your eLux device boots into a read-only filesystem or prevents saving changes, it’s usually due to the write filter or system protection settings. Here’s how to identify and fix the issue.
Common Causes
- Write Filter is enabled (RAM overlay by default)
- System partition is locked as part of image protection
- Corrupted overlay from improper shutdown
Fix 1: Temporarily Remount as Read/Write
sudo mount -o remount,rw /This allows you to make temporary changes. They will be lost after reboot unless you adjust the image or profile settings.
Fix 2: Enable Persistent Mode via the EIS Tool
- Open your image project in the EIS Tool
- Go to the Settings tab
- Locate the write filter or storage persistence section
- Set it to Persistent Storage
- Export the updated image and redeploy
Fix 3: Enable Persistence via Scout Configuration Profile
- Open Scout Enterprise Console
- Go to Configuration > Profiles
- Edit the assigned profile
- Enable options like:
- Persistent user data
- Persistent certificate storage
- Persistent logging
- Save and reassign the profile
Fix 4: Reimage the Device
- If the system is damaged or stuck in read-only permanently, use a USB stick or PXE deployment to reflash the device.
- Ensure the new image has persistence enabled in the EIS Tool before deploying.
Check Filesystem Mount Status
mount | grep ' / 'If you see (ro) in the output, the system is in read-only mode.
Final Notes
- eLux protects system partitions by design — use Scout and EIS Tool to make lasting changes
- Remounting manually is fine for diagnostics but not a long-term fix
- Always test changes on a test device before rolling out to production
Elux Image Deployment
How to Create and Deploy a Custom eLux Image at Scale
This guide is intended for Linux/VDI system administrators managing eLux thin clients across enterprise environments. It covers:
- Part 1: Creating a fresh, customized eLux image
- Part 2: Deploying the image at scale using Scout Enterprise
Part 1: Creating a Custom eLux Image with Tailored Settings
Step 1: Download Required Files
- Go to https://www.myelux.com and log in.
- Download the following:
- Base OS image (e.g.,
elux-RP6-base.ufi) - Module files (
.ulc) – Citrix, VMware, Firefox, etc. - EIS Tool (eLux Image Stick Tool) for your admin OS
- Base OS image (e.g.,
Step 2: Install and Open the EIS Tool
- Install the EIS Tool on a Windows or Linux system.
- Launch the tool and click New Project.
- Select the downloaded
.ufibase image. - Name your project (e.g.,
elux-custom-v1) and confirm.
Step 3: Add or Remove Modules
- Go to the Modules tab inside the EIS Tool.
- Click Add and import the required
.ulcfiles. - Deselect any modules you don’t need.
- Click Apply to save module selections.
Step 4: Modify System Settings (Optional)
- Set default screen resolution
- Enable or disable write protection
- Choose RAM overlay or persistent storage
- Enable shell access if needed for support
- Disable unneeded services
Step 5: Export the Image
- To USB stick:
Click "Write to USB Stick" Select your USB target drive - To file for network deployment:
Click "Export Image"
Save your customized .ufi (e.g., elux-custom-v1.ufi)
Part 2: Deploying the Custom Image at Scale Using Scout Enterprise
Step 1: Import the Image into Scout
- Open Scout Enterprise Console
- Navigate to Repository > Images
- Right-click → Import Image
- Select the
.ufifile created earlier
Step 2: Create and Configure a Profile
- Go to Configuration > Profiles
- Click New Profile
- Configure network, session, and UI settings
- Save and name the profile (e.g.,
Citrix-Kiosk-Profile)
Step 3: Assign Image and Profile to Devices or Groups
- Navigate to Devices or Groups
- Right-click → Assign OS Image
- Select your custom
.ufi - Right-click → Assign Profile
- Select your configuration profile
Step 4: Deploy the Image
Option A: PXE Network Deployment
- Enable PXE boot on client devices (via BIOS)
- Ensure PXE services are running (Scout or custom)
- On reboot, clients auto-deploy image and config
Option B: USB Stick Installation
- Boot client device from prepared USB stick
- Follow on-screen instructions to install
- Device registers and pulls config from Scout
Step 5: Monitor Deployment
- Use Logs > Job Queue to track installations
- Search for devices to confirm version and status
Optional Commands
Inspect or Write Images
# Mount .ufi image (read-only)
sudo mount -o loop elux-custom.ufi /mnt/elux

# Write image to USB on Linux
sudo dd if=elux-custom.ufi of=/dev/sdX bs=4M status=progress
Manual PXE Server Setup (Linux)
sudo apt install tftpd-hpa dnsmasq

# Example dnsmasq.conf
port=0
interface=eth0
dhcp-range=192.168.1.100,192.168.1.200,12h
dhcp-boot=pxelinux.0
enable-tftp
tftp-root=/srv/tftp

sudo systemctl restart tftpd-hpa
dsudo systemctl restart dnsmasq
Commands on eLux Device Shell
# Switch to shell (Ctrl+Alt+F1), then:
uname -a
df -h
scout showconfig
scout pullconfig
Summary
| Task | Tool |
|---|---|
| Build custom image | EIS Tool |
| Add/remove software modules | .ulc files + EIS Tool |
| Customize settings | EIS Tool + Scout Profile |
| Deploy to all clients | PXE boot or USB + Scout |
| Manage and monitor at scale | Scout Enterprise Console |
Key Components for Setting Up an HPC Cluster
Head Node (Controller)
Compute Nodes
Networking
Storage
Authentication
Scheduler
Resource Management
Parallel File System (Optional)
Interconnect Libraries
Monitoring and Debugging Tools
How to configure Slurm Controller Node on Ubuntu 22.04
How to setup HPC-Slurm Controller Node
Refer to Key Components for HPC Cluster Setup; for which pieces you need to setup.
This guide provides step-by-step instructions for setting up the Slurm controller daemon (`slurmctld`) on Ubuntu 22.04. It also includes common errors encountered during the setup process and how to resolve them.
Step 1: Install Prerequisites
To begin, install the required dependencies for Slurm and its components:
sudo apt update && sudo apt upgrade -y
sudo apt install -y munge libmunge-dev libmunge2 build-essential man-db mariadb-server mariadb-client libmariadb-dev python3 python3-pip chrony
Step 2: Configure Munge (Authentication for slurm)
Munge is required for authentication within the Slurm cluster.
1. Generate a Munge key on the controller node:
sudo create-munge-key
2. Copy the key to all compute nodes:
scp /etc/munge/munge.key user@node:/etc/munge/
3. Start the Munge service:
sudo systemctl enable –now munge
Step 3: Install Slurm
1. Download and compile Slurm:
wget https://download.schedmd.com/slurm/slurm-23.02.4.tar.bz2
tar -xvjf slurm-23.02.4.tar.bz2
cd slurm-23.02.4
./configure –prefix=/usr/local/slurm –sysconfdir=/etc/slurm
make -j$(nproc)
sudo make install
2. Create necessary directories and set permissions:
sudo mkdir -p /etc/slurm /var/spool/slurm /var/log/slurm
sudo chown slurm: /var/spool/slurm /var/log/slurm
3. Add the Slurm user:
sudo useradd -m slurm
Step 4: Configure Slurm; more complex configs contact Nick Tailor
1. Generate a basic `slurm.conf` using the configurator tool at
https://slurm.schedmd.com/configurator.html. Save the configuration to `/etc/slurm/slurm.conf`.
# Basic Slurm Configuration
ClusterName=my_cluster
ControlMachine=slurmctld # Replace with your control node’s hostname
# BackupController=backup-slurmctld # Uncomment and replace if you have a backup controller
# Authentication
AuthType=auth/munge
CryptoType=crypto/munge
# Logging
SlurmdLogFile=/var/log/slurm/slurmd.log
SlurmctldLogFile=/var/log/slurm/slurmctld.log
SlurmctldDebug=info
SlurmdDebug=info
# Slurm User
SlurmUser=slurm
StateSaveLocation=/var/spool/slurm
SlurmdSpoolDir=/var/spool/slurmd
# Scheduler
SchedulerType=sched/backfill
SchedulerParameters=bf_continue
# Accounting
AccountingStorageType=accounting_storage/none
JobAcctGatherType=jobacct_gather/linux
# Compute Nodes
NodeName=node[1-2] CPUs=4 RealMemory=8192 State=UNKNOWN
PartitionName=debug Nodes=node[1-2] Default=YES MaxTime=INFINITE State=UP
2. Distribute `slurm.conf` to all compute nodes:
scp /etc/slurm/slurm.conf user@node:/etc/slurm/
3. Restart Slurm services:
sudo systemctl restart slurmctld
sudo systemctl restart slurmd
Troubleshooting Common Errors
root@slrmcltd:~# tail /var/log/slurm/slurmctld.log
[2024-12-06T11:57:25.428] error: High latency for 1000 calls to gettimeofday(): 20012 microseconds
[2024-12-06T11:57:25.431] fatal: mkdir(/var/spool/slurm): Permission denied
[2024-12-06T11:58:34.862] error: High latency for 1000 calls to gettimeofday(): 20029 microseconds
[2024-12-06T11:58:34.864] fatal: mkdir(/var/spool/slurm): Permission denied
[2024-12-06T11:59:38.843] error: High latency for 1000 calls to gettimeofday(): 18842 microseconds
[2024-12-06T11:59:38.847] fatal: mkdir(/var/spool/slurm): Permission denied
Error: Permission Denied for /var/spool/slurm
This error occurs when the `slurm` user does not have the correct permissions to access the directory.
Fix:
sudo mkdir -p /var/spool/slurm
sudo chown -R slurm: /var/spool/slurm
sudo chmod -R 755 /var/spool/slurm
Error: Temporary Failure in Name Resolution
Slurm could not resolve the hostname `slurmctld`. This can be fixed by updating `/etc/hosts`:
1. Edit `/etc/hosts` and add the following:
127.0.0.1 slurmctld
192.168.20.8 slurmctld
2. Verify the hostname matches `ControlMachine` in `/etc/slurm/slurm.conf`.
3. Restart networking and test hostname resolution:
sudo systemctl restart systemd-networkd
ping slurmctld
Error: High Latency for gettimeofday()
Dec 06 11:57:25 slrmcltd.home systemd[1]: Started Slurm controller daemon.
Dec 06 11:57:25 slrmcltd.home slurmctld[2619]: slurmctld: error: High latency for 1000 calls to gettimeofday(): 20012 microseconds
Dec 06 11:57:25 slrmcltd.home systemd[1]: slurmctld.service: Main process exited, code=exited, status=1/FAILURE
Dec 06 11:57:25 slrmcltd.home systemd[1]: slurmctld.service: Failed with result ‘exit-code’.
This warning typically indicates timing issues in the system.
Fixes:
1. Install and configure `chrony` for time synchronization:
sudo apt install chrony
sudo systemctl enable –now chrony
chronyc tracking
timedatectl
2. For virtualized environments, optimize the clocksource:
sudo echo tsc > /sys/devices/system/clocksource/clocksource0/current_clocksource
3. Disable high-precision timing in `slurm.conf` (optional):
HighPrecisionTimer=NO
sudo systemctl restart slurmctld
Step 5: Verify and Test the Setup
1. Validate the configuration:
scontrol reconfigure
– no errors mean its working. If this doesn’t work check the connection between nodes
update your /etc/hosts to have the hosts all listed across the all machines and nodes.
2. Check node and partition status:
sinfo
root@slrmcltd:/etc/slurm# sinfo
PARTITION AVAIL TIMELIMIT NODES STATE NODELIST
debug* up infinite 1 idle* node1
3. Monitor logs for errors:
sudo tail -f /var/log/slurm/slurmctld.log
Written By: Nick Tailor