Author: admin
Kubernetes Cheat Sheet
kubectl Context and Configuration
Manage which Kubernetes cluster kubectl communicates with, and configure authentication and namespace defaults.
kubectl config view                               # View merged kubeconfig

# Use multiple kubeconfig files simultaneously
export KUBECONFIG=~/.kube/config:~/.kube/kubconfig2
kubectl config view

# Extract a specific user's password
kubectl config view -o jsonpath='{.users[?(@.name == "e2e")].user.password}'

# List users
kubectl config view -o jsonpath='{.users[*].name}'

# Context management
kubectl config get-contexts                        # List contexts
kubectl config current-context                     # Show active context
kubectl config use-context my-cluster              # Switch context

# Add a cluster entry
kubectl config set-cluster my-cluster

# Set proxy URL for cluster entry
kubectl config set-cluster my-cluster --proxy-url=my-proxy-url

# Add a user with basic authentication
kubectl config set-credentials kubeuser/foo.kubernetes.com \
  --username=kubeuser --password=kubepassword

# Set default namespace for current context
kubectl config set-context --current --namespace=production

# Set a new context with specific namespace and user
kubectl config set-context gce --user=cluster-admin --namespace=foo \
  && kubectl config use-context gce

# Delete a user
kubectl config unset users.foo
Helpful aliases:
# Quickly switch or show context
alias kx='f() { [ "$1" ] && kubectl config use-context $1 || kubectl config current-context ; } ; f'

# Quickly switch or show namespace
alias kn='f() { [ "$1" ] && kubectl config set-context --current --namespace $1 \
  || kubectl config view --minify | grep namespace | cut -d" " -f6 ; } ; f'
kubectl apply (Declarative Management)
kubectl apply is the recommended method for managing resources in production. It creates or updates resources by applying a desired state.
kubectl apply -f ./app.yaml                         # Apply single file
kubectl apply -f ./manifests/                       # Apply directory
kubectl apply -f https://example.com/app.yaml       # Apply from URL

kubectl create deployment nginx --image=nginx       # Quick one-shot deployment
Create multiple manifests via stdin:
cat <<EOF | kubectl apply -f -
apiVersion: v1
kind: Pod
metadata:
  name: pod-one
spec:
  containers:
  - name: c
    image: busybox
    args: ["sleep", "1000"]
---
apiVersion: v1
kind: Pod
metadata:
  name: pod-two
spec:
  containers:
  - name: c
    image: busybox
    args: ["sleep", "2000"]
EOF
Create a secret:
cat <<EOF | kubectl apply -f -
apiVersion: v1
kind: Secret
metadata:
  name: mysecret
type: Opaque
data:
  username: $(echo -n "jane" | base64 -w0)
  password: $(echo -n "s33msi4" | base64 -w0)
EOF
Viewing and Finding Resources
kubectl get pods                                   # Pods in namespace
kubectl get pods -A                                # All namespaces
kubectl get pods -o wide                           # Pod node placement
kubectl get deployments                            # Deployments
kubectl get svc                                     # Services
kubectl describe pod my-pod                         # Detailed pod info
kubectl describe node my-node                       # Node details
Sorting:
kubectl get pods --sort-by='.status.containerStatuses[0].restartCount'
kubectl get pv --sort-by=.spec.capacity.storage
Field and label selectors:
kubectl get pods --field-selector=status.phase=Running
kubectl get pods -l app=web
kubectl get nodes --selector='!node-role.kubernetes.io/control-plane'
Retrieve specific fields:
kubectl get configmap myconfig -o jsonpath='{.data.ca\.crt}'
kubectl get secret my-secret -o jsonpath='{.data.username}' | base64 --decode
Updating Resources and Rolling Updates
kubectl set image deployment/web web=nginx:1.25          # Update image
kubectl rollout history deployment/web                    # View history
kubectl rollout undo deployment/web                       # Roll back
kubectl rollout restart deployment/web                    # Rolling restart
kubectl rollout status deployment/web                     # Watch rollout
Patching Resources
kubectl patch node node1 -p '{"spec": {"unschedulable": true}}'

# Strategic merge patch
kubectl patch pod app-pod -p '{
  "spec": {"containers":[{"name":"app","image":"new-image"}]}
}'

# JSON patch
kubectl patch pod app-pod --type=json -p='[
  {"op":"replace","path":"/spec/containers/0/image","value":"new-image"}
]'
Editing Resources
kubectl edit svc/web-service
KUBE_EDITOR="nano" kubectl edit deployment/web

Change between:
ClusterIP
NodePort
LoadBalancer
ExternalName
Port
Targetport
NodePort
Protocol
Scaling Resources
kubectl scale deployment/web --replicas=5
kubectl scale -f deployment.yaml --replicas=4
Deleting Resources
kubectl delete -f ./app.yaml
kubectl delete pod my-pod --now
kubectl delete pods,svc -l app=web
kubectl delete pod,svc --all -n test
Interacting With Running Pods
kubectl logs my-pod
kubectl logs -f my-pod
kubectl exec my-pod -- ls /
kubectl exec -it my-pod -- sh
kubectl port-forward svc/web 8080:80
Copying Files to and from Containers
kubectl cp /tmp/localfile my-pod:/tmp/remote
kubectl cp my-pod:/tmp/remote /tmp/localfile
Advanced (using tar):
tar cf - . | kubectl exec -i my-pod -- tar xf - -C /tmp
Interacting With Nodes and Cluster
kubectl cordon node1
kubectl drain node1
kubectl uncordon node1

kubectl top node
kubectl top pod

kubectl cluster-info
kubectl cluster-info dump
Discovering API Resources
kubectl api-resources
kubectl api-resources --namespaced=true
kubectl api-resources -o wide
kubectl api-resources --verbs=list,get
Kubectl Output Formatting
kubectl get pods -o json
kubectl get pods -o yaml
kubectl get pods -o wide
kubectl get pods -o name
kubectl get pods -o jsonpath='{.items[*].metadata.name}'
Custom columns:
kubectl get pods -A -o=custom-columns='IMAGE:spec.containers[*].image'
Kubectl Verbosity and Debugging
- –v=0 Minimal logs
- –v=2 Recommended default
- –v=4 Debug level
- –v=6+ Full HTTP request inspection
Production-Ready Deployment YAML (Corrected)
Below is a cleaned-up and production-ready Deployment YAML based on your original example.
apiVersion: apps/v1
kind: Deployment
metadata:
  name: nginx-deployment
  namespace: my-namespace
  labels:
    app: nginx
spec:
  replicas: 3
  revisionHistoryLimit: 5
  selector:
    matchLabels:
      app: nginx
  template:
    metadata:
      labels:
        app: nginx
    spec:
      securityContext:
        runAsNonRoot: true
        runAsUser: 1000
        fsGroup: 1000
      containers:
        - name: nginx
          image: nginx:1.25
          ports:
            - containerPort: 80
          resources:
            requests:
              cpu: "100m"
              memory: "128Mi"
            limits:
              cpu: "300m"
              memory: "256Mi"
          readinessProbe:
            httpGet:
              path: /
              port: 80
            initialDelaySeconds: 3
            periodSeconds: 10
          livenessProbe:
            httpGet:
              path: /
              port: 80
            initialDelaySeconds: 10
            periodSeconds: 20
          securityContext:
            readOnlyRootFilesystem: true
            allowPrivilegeEscalation: false
Conclusion
Kubernetes Cheat Sheet
This Kubernetes cheat sheet is a comprehensive and practical reference for working with kubectl, managing kubeconfig files, deploying Kubernetes workloads, viewing and troubleshooting cluster resources, and interacting with running workloads. It also includes a corrected production-ready Deployment YAML example. Everything below is ready to copy and paste directly into your WordPress editor.
kubectl Context and Configuration
Manage which Kubernetes cluster kubectl communicates with, and configure authentication and namespace defaults.
kubectl config view                               # View merged kubeconfig
# Use multiple kubeconfig files simultaneously
export KUBECONFIG=~/.kube/config:~/.kube/kubconfig2
kubectl config view
# Extract a specific user's password
kubectl config view -o jsonpath='{.users[?(@.name == "e2e")].user.password}'
# List users
kubectl config view -o jsonpath='{.users[*].name}'
# Context management
kubectl config get-contexts                        # List contexts
kubectl config current-context                     # Show active context
kubectl config use-context my-cluster              # Switch context
# Add a cluster entry
kubectl config set-cluster my-cluster
# Set proxy URL for cluster entry
kubectl config set-cluster my-cluster --proxy-url=my-proxy-url
# Add a user with basic authentication
kubectl config set-credentials kubeuser/foo.kubernetes.com \
  --username=kubeuser --password=kubepassword
# Set default namespace for current context
kubectl config set-context --current --namespace=production
# Set a new context with specific namespace and user
kubectl config set-context gce --user=cluster-admin --namespace=foo \
  && kubectl config use-context gce
# Delete a user
kubectl config unset users.foo
Helpful aliases:
# Quickly switch or show context
alias kx='f() { [ "$1" ] && kubectl config use-context $1 || kubectl config current-context ; } ; f'
# Quickly switch or show namespace
alias kn='f() { [ "$1" ] && kubectl config set-context --current --namespace $1 \
  || kubectl config view --minify | grep namespace | cut -d" " -f6 ; } ; f'
kubectl apply (Declarative Management)
kubectl apply is the recommended method for managing resources in production. It creates or updates resources by applying a desired state.
kubectl apply -f ./app.yaml                         # Apply single file
kubectl apply -f ./manifests/                       # Apply directory
kubectl apply -f https://example.com/app.yaml       # Apply from URL
kubectl create deployment nginx --image=nginx       # Quick one-shot deployment
Create multiple manifests via stdin:
cat <Create a secret:
cat <Viewing and Finding Resources
kubectl get pods                                   # Pods in namespace
kubectl get pods -A                                # All namespaces
kubectl get pods -o wide                           # Pod node placement
kubectl get deployments                            # Deployments
kubectl get svc                                     # Services
kubectl describe pod my-pod                         # Detailed pod info
kubectl describe node my-node                       # Node details
Sorting:
kubectl get pods --sort-by='.status.containerStatuses[0].restartCount'
kubectl get pv --sort-by=.spec.capacity.storage
Field and label selectors:
kubectl get pods --field-selector=status.phase=Running
kubectl get pods -l app=web
kubectl get nodes --selector='!node-role.kubernetes.io/control-plane'
Retrieve specific fields:
kubectl get configmap myconfig -o jsonpath='{.data.ca\.crt}'
kubectl get secret my-secret -o jsonpath='{.data.username}' | base64 --decode
Updating Resources and Rolling Updates
kubectl set image deployment/web web=nginx:1.25          # Update image
kubectl rollout history deployment/web                    # View history
kubectl rollout undo deployment/web                       # Roll back
kubectl rollout restart deployment/web                    # Rolling restart
kubectl rollout status deployment/web                     # Watch rollout
Patching Resources
kubectl patch node node1 -p '{"spec": {"unschedulable": true}}'
# Strategic merge patch
kubectl patch pod app-pod -p '{
  "spec": {"containers":[{"name":"app","image":"new-image"}]}
}'
# JSON patch
kubectl patch pod app-pod --type=json -p='[
  {"op":"replace","path":"/spec/containers/0/image","value":"new-image"}
]'
Editing Resources
kubectl edit svc/web-service
KUBE_EDITOR="nano" kubectl edit deployment/web
Scaling Resources
kubectl scale deployment/web --replicas=5
kubectl scale -f deployment.yaml --replicas=4
Deleting Resources
kubectl delete -f ./app.yaml
kubectl delete pod my-pod --now
kubectl delete pods,svc -l app=web
kubectl delete pod,svc --all -n test
Interacting With Running Pods
kubectl logs my-pod
kubectl logs -f my-pod
kubectl exec my-pod -- ls /
kubectl exec -it my-pod -- sh
kubectl port-forward svc/web 8080:80
Copying Files to and from Containers
kubectl cp /tmp/localfile my-pod:/tmp/remote
kubectl cp my-pod:/tmp/remote /tmp/localfile
Advanced (using tar):
tar cf - . | kubectl exec -i my-pod -- tar xf - -C /tmp
Interacting With Nodes and Cluster
kubectl cordon node1
kubectl drain node1
kubectl uncordon node1
kubectl top node
kubectl top pod
kubectl cluster-info
kubectl cluster-info dump
Discovering API Resources
kubectl api-resources
kubectl api-resources --namespaced=true
kubectl api-resources -o wide
kubectl api-resources --verbs=list,get
Kubectl Output Formatting
kubectl get pods -o json
kubectl get pods -o yaml
kubectl get pods -o wide
kubectl get pods -o name
kubectl get pods -o jsonpath='{.items[*].metadata.name}'
Custom columns:
kubectl get pods -A -o=custom-columns='IMAGE:spec.containers[*].image'
Kubectl Verbosity and Debugging
- –v=0 Minimal logs
- –v=2 Recommended default
- –v=4 Debug level
- –v=6+ Full HTTP request inspection
Production-Ready Deployment YAML (Corrected)
Below is a cleaned-up and production-ready Deployment YAML based on your original example.
apiVersion: apps/v1
kind: Deployment
metadata:
  name: nginx-deployment
  namespace: my-namespace
  labels:
    app: nginx
spec:
  replicas: 3
  revisionHistoryLimit: 5
  selector:
    matchLabels:
      app: nginx
  template:
    metadata:
      labels:
        app: nginx
    spec:
      securityContext:
        runAsNonRoot: true
        runAsUser: 1000
        fsGroup: 1000
      containers:
        - name: nginx
          image: nginx:1.25
          ports:
            - containerPort: 80
          resources:
            requests:
              cpu: "100m"
              memory: "128Mi"
            limits:
              cpu: "300m"
              memory: "256Mi"
          readinessProbe:
            httpGet:
              path: /
              port: 80
            initialDelaySeconds: 3
            periodSeconds: 10
          livenessProbe:
            httpGet:
              path: /
              port: 80
            initialDelaySeconds: 10
            periodSeconds: 20
          securityContext:
            readOnlyRootFilesystem: true
            allowPrivilegeEscalation: false
Conclusion
This Kubernetes cheat sheet provides a complete quick-reference for daily cluster operations, including context switching, applying manifests, rolling updates, patching, scaling, and debugging. With the included production-ready Deployment YAML and working examples, you can confidently operate Kubernetes clusters and deploy applications using the recommended declarative approach.
Deploying Lustre File System with RDMA, Node Maps, and ACLs
Lustre is the de facto parallel file system for high-performance computing (HPC) clusters, providing extreme scalability, high throughput, and low-latency access across thousands of nodes. This guide walks through a complete deployment of Lustre using RDMA over InfiniBand for performance, along with Node Maps for client access control and ACLs for fine-grained permissions.
1. Understanding the Lustre Architecture
Lustre separates metadata and data services into distinct roles:
- MGS (Management Server) – Manages Lustre configuration and coordinates cluster services.
- MDT (Metadata Target) – Stores file system metadata (names, permissions, directories).
- OST (Object Storage Target) – Stores file data blocks.
- Clients – Mount and access the Lustre file system for I/O.
The typical architecture looks like this:
+-------------+        +-------------+
|   Client 1  |        |   Client 2  |
| /mnt/lustre |        | /mnt/lustre |
+------+------+        +------+------+
       |                        |
       +--------o2ib RDMA-------+
                |
        +-------+-------+
        |     OSS/OST    |
        |   (Data I/O)   |
        +-------+-------+
                |
        +-------+-------+
        |     MGS/MDT    |
        |  (Metadata)    |
        +---------------+
2. Prerequisites and Environment
| Component | Requirements |
|---|---|
| OS | RHEL / Rocky / AlmaLinux 8.x or higher |
| Kernel | Built with Lustre and OFED RDMA modules |
| Network | InfiniBand fabric (Mellanox or compatible) |
| Lustre Version | 2.14 or later |
| Devices | Separate block devices for MDT, OST(s), and client mount |
3. Install Lustre Packages
On MGS, MDT, and OSS Nodes:
dnf install -y lustre kmod-lustre lustre-osd-ldiskfs
On Client Nodes:
dnf install -y lustre-client kmod-lustre-client
4. Configure InfiniBand and RDMA (o2ib)
InfiniBand provides the lowest latency for Lustre communication via RDMA. Configure the o2ib network type for Lustre.
1. Install and verify InfiniBand stack
dnf install -y rdma-core infiniband-diags perftest libibverbs-utils
systemctl enable --now rdma
ibstat
2. Configure IB network
nmcli con add type infiniband ifname ib0 con-name ib0 ip4 10.0.0.1/24
nmcli con up ib0
3. Verify RDMA link
ibv_devinfo
ibv_rc_pingpong -d mlx5_0
4. Configure LNET for o2ib
Create /etc/modprobe.d/lustre.conf with:
options lnet networks="o2ib(ib0)"
modprobe lnet
lnetctl lnet configure
lnetctl net add --net o2ib --if ib0
lnetctl net show
Expected output:
net:
  - net type: o2ib
    interfaces:
      0: ib0
5. Format and Mount Lustre Targets
Metadata Server (MGS + MDT)
mkfs.lustre --fsname=lustrefs --mgs --mdt --index=0 /dev/sdb
mount -t lustre /dev/sdb /mnt/mdt
Object Storage Server (OSS)
mkfs.lustre --fsname=lustrefs --ost --index=0 --mgsnode=<MGS>@o2ib /dev/sdc
mount -t lustre /dev/sdc /mnt/ost
Client Node
mount -t lustre <MGS>@o2ib:/lustrefs /mnt/lustre
sudo mkdir -p /mnt/lustre

sudo mount -t lustre \
  172.16.0.10@o2ib:/lustrefs \
  /mnt/lustre

example without ibnetwork
[root@vbox ~]# mount -t lustre 172.16.0.10@tcp:/lustre /mnt/lustre-client
[root@vbox ~]#
[root@vbox ~]# # Verify the mount worked
[root@vbox ~]# df -h /mnt/lustre-client
Filesystem                Size  Used Avail Use% Mounted on
172.16.0.10@tcp:/lustre   12G  2.5M   11G   1% /mnt/lustre-client
[root@vbox ~]# lfs df -h
UUID                       bytes        Used   Available Use% Mounted on
lustre-MDT0000_UUID         4.5G        1.9M        4.1G   1% /mnt/lustre-client[MDT:0]
lustre-OST0000_UUID         7.5G        1.2M        7.0G   1% /mnt/lustre-client[OST:0]
lustre-OST0001_UUID         3.9G        1.2M        3.7G   1% /mnt/lustre-client[OST:1]
filesystem_summary:        11.4G        2.4M       10.7G   1% /mnt/lustre-client
6. Configuring Node Maps (Access Control)
Node maps allow administrators to restrict Lustre client access based on network or host identity.
1. View current node maps
lctl nodemap_list
2. Create a new node map for trusted clients
lctl nodemap_add trusted_clients
3. Add allowed network range or host
lctl nodemap_add_range trusted_clients 10.0.0.0/24
4. Enable enforcement
lctl set_param nodemap.trusted_clients.admin=1
lctl set_param nodemap.trusted_clients.trust_client_ids=1
5. Restrict default map
lctl set_param nodemap.default.reject_unauthenticated=1
This ensures only IPs in 10.0.0.0/24 can mount and access the Lustre filesystem.
7. Configuring Access Control Lists (ACLs)
Lustre supports standard POSIX ACLs for fine-grained directory and file permissions.
1. Enable ACL support on mount
mount -t lustre -o acl <MGS>@o2ib:/lustrefs /mnt/lustre
2. Verify ACL support
mount | grep lustre
Should show:
/dev/sda on /mnt/lustre type lustre (rw,acl)
3. Set ACLs on directories
setfacl -m u:researcher:rwx /mnt/lustre/projects
setfacl -m g:analysts:rx /mnt/lustre/reports
4. View ACLs
getfacl /mnt/lustre/projects
Sample output:
# file: projects
# owner: root
# group: root
user::rwx
user:researcher:rwx
group::r-x
group:analysts:r-x
mask::rwx
other::---
8. Verifying Cluster Health
On all nodes:
lctl ping <MGS>@o2ib
lctl dl
lctl get_param -n net.*.state
Check RDMA performance:
lctl get_param -n o2iblnd.*.stats
Check file system mount from client:
df -h /mnt/lustre
Optional: Check node map enforcement
Try mounting from an unauthorized IP — it should fail:
mount -t lustre <MGS>@o2ib:/lustrefs /mnt/test
mount.lustre: mount <MGS>@o2ib:/lustrefs at /mnt/test failed: Permission denied
9. Common Issues and Troubleshooting
| Issue | Possible Cause | Resolution |
|---|---|---|
Mount failed: no route to host | IB subnet mismatch or LNET not configured | Verify lnetctl net show and ping -I ib0 between nodes. |
Permission denied | Node map restriction active | Check lctl nodemap_list and ensure client IP range is allowed. |
Slow performance | RDMA disabled or fallback to TCP | Verify lctl list_nids shows @o2ib transport. |
10. Final Validation Checklist
- InfiniBand RDMA verified with
ibv_rc_pingpong - LNET configured for
o2ib(ib0) - MGS, MDT, and OST mounted successfully
- Clients connected via
@o2ib - Node maps restricting unauthorized hosts
- ACLs correctly enforcing directory-level access
Summary
With RDMA transport, Lustre achieves near line-rate performance while node maps and ACLs enforce robust security and access control. This combination provides a scalable, high-performance, and policy-driven storage environment ideal for AI, HPC, and research workloads.
Mastering Podman: A Comprehensive Guide with Detailed Command Examples
Mastering Podman on Ubuntu: A Comprehensive Guide with Detailed Command Examples
Podman has become a popular alternative to Docker due to its flexibility, security, and rootless operation capabilities. This guide will walk you through the installation process and various advanced usage scenarios of Podman on Ubuntu, providing detailed examples for each command.
Table of Contents
1. How to Install Podman
To get started with Podman on Ubuntu, follow these steps:
Update Package Index
Before installing any new software, it’s a good idea to update your package index to ensure you’re getting the latest version of Podman:
sudo apt update
Install Podman
With your package index updated, you can now install Podman. This command will download and install Podman and any necessary dependencies:
sudo apt install podman -y
Example Output:
kotlin
Reading package lists… Done
Building dependency tree
Reading state information… Done
The following additional packages will be installed:
…
After this operation, X MB of additional disk space will be used.
Do you want to continue? [Y/n] y
…
Setting up podman (4.0.2) …
Verifying Installation
After installation, verify that Podman is installed correctly:
podman –version
Example Output:
podman version 4.0.2
2. How to Search for Images
Before running a container, you may need to find an appropriate image. Podman allows you to search for images in various registries.
Search Docker Hub
To search for images on Docker Hub:
podman search ubuntu
Example Output:
lua
INDEX NAME DESCRIPTION STARS OFFICIAL AUTOMATED
docker.io docker.io/library/ubuntu Ubuntu is a Debian-based Linux operating sys… 12329 [OK]
docker.io docker.io/ubuntu-upstart Upstart is an event-based replacement for the … 108 [OK]
docker.io docker.io/tutum/ubuntu Ubuntu image with SSH access. For the root p… 39
docker.io docker.io/ansible/ubuntu14.04-ansible Ubuntu 14.04 LTS with ansible 9 [OK]
This command will return a list of Ubuntu images available in Docker Hub.
3. How to Run Rootless Containers
One of the key features of Podman is the ability to run containers without needing root privileges, enhancing security.
Running a Rootless Container
As a non-root user, you can run a container like this:
podman run –rm -it ubuntu
Example Output:
ruby
root@d2f56a8d1234:/#
This command runs an Ubuntu container in an interactive shell, without requiring root access on the host system.
Configuring Rootless Environment
Ensure your user is added to the subuid and subgid files for proper UID/GID mapping:
echo “$USER:100000:65536” | sudo tee -a /etc/subuid /etc/subgid
Example Output:
makefile
user:100000:65536
user:100000:65536
4. How to Search for Containers
Once you start using containers, you may need to find specific ones.
Listing All Containers
To list all containers (both running and stopped):
podman ps -a
Example Output:
CONTAINER ID IMAGE COMMAND CREATED STATUS PORTS NAMES
d13c5bcf30fd docker.io/library/ubuntu:latest 3 minutes ago Exited (0) 2 minutes ago confident_mayer
Filtering Containers
You can filter containers by their status, names, or other attributes. For instance, to find running containers:
podman ps –filter status=running
Example Output:
CONTAINER ID IMAGE COMMAND CREATED STATUS PORTS NAMES
No output indicates there are no running containers at the moment.
5. How to Add Ping to Containers
Some minimal Ubuntu images don’t come with ping installed. Here’s how to add it.
Installing Ping in an Ubuntu Container
First, start an Ubuntu container:
podman run -it –cap-add=CAP_NET_RAW ubuntu
Inside the container, install ping (part of the iputils-ping package):
apt update
apt install iputils-ping
Example Output:
mathematica
Get:1 http://archive.ubuntu.com/ubuntu focal InRelease [265 kB]
…
Setting up iputils-ping (3:20190709-3) …
Now you can use ping within the container.
6. How to Expose Ports
Exposing ports is crucial for running services that need to be accessible from outside the container.
Exposing a Port
To expose a port, use the -p flag with the podman run command:
podman run -d -p 8080:80 ubuntu -c “apt update && apt install -y nginx && nginx -g ‘daemon off;'”
Example Output:
54c11dff6a8d9b6f896028f2857c6d74bda60f61ff178165e041e5e2cb0c51c8
This command runs an Ubuntu container, installs Nginx, and exposes port 80 in the container as port 8080 on the host.
Exposing Multiple Ports
You can expose multiple ports by specifying additional -p flags:
podman run -d -p 8080:80 -p 443:443 ubuntu -c “apt update && apt install -y nginx && nginx -g ‘daemon off;'”
Example Output:
wasm
b67f7d89253a4e8f0b5f64dcb9f2f1d542973fbbce73e7cdd6729b35e0d1125c
7. How to Create a Network
Creating a custom network allows you to isolate containers and manage their communication.
Creating a Network
To create a new network:
podman network create mynetwork
Example Output:
mynetwork
This command creates a new network named mynetwork.
Running a Container on a Custom Network
podman run -d –network mynetwork ubuntu -c “apt update && apt install -y nginx && nginx -g ‘daemon off;'”
Example Output:
1e0d2fdb110c8e3b6f2f4f5462d1c9b99e9c47db2b16da6b2de1e4d9275c2a50
This container will now communicate with others on the mynetwork network.
8. How to Connect a Network Between Pods
Podman allows you to manage pods, which are groups of containers sharing the same network namespace.
Creating a Pod and Adding Containers
podman pod create mypod
podman run -dt –pod mypod ubuntu -c “apt update && apt install -y nginx && nginx -g ‘daemon off;'”
podman run -dt –pod mypod ubuntu -c “apt update && apt install -y redis-server && redis-server”
Example Output:
f04d1c28b030f24f3f7b91f9f68d07fe1e6a2d81caeb60c356c64b3f7f7412c7
8cf540eb8e1b0566c65886c684017d5367f2a167d82d7b3b8c3496cbd763d447
4f3402b31e20a07f545dbf69cb4e1f61290591df124bdaf736de64bc3d40d4b1
Both containers now share the same network namespace and can communicate over the mypod network.
Connecting Pods to a Network
To connect a pod to an existing network:
podman pod create –network mynetwork mypod
Example Output:
f04d1c28b030f24f3f7b91f9f68d07fe1e6a2d81caeb60c356c64b3f7f7412c7
This pod will use the mynetwork network, allowing communication with other containers on that network.
9. How to Inspect a Network
Inspecting a network provides detailed information about the network configuration and connected containers.
Inspecting a Network
Use the podman network inspect command:
podman network inspect mynetwork
Example Output:
json
[
{
“name”: “mynetwork”,
“id”: “3c0d6e2eaf3c4f3b98a71c86f7b35d10b9d4f7b749b929a6d758b3f76cd1f8c6”,
“driver”: “bridge”,
“network_interface”: “cni-podman0”,
“created”: “2024-08-12T08:45:24.903716327Z”,
“subnets”: [
{
“subnet”: “10.88.1.0/24”,
“gateway”: “10.88.1.1”
}
],
“ipv6_enabled”: false,
“internal”: false,
“dns_enabled”: true,
“network_dns_servers”: [
“8.8.8.8”
]
}
]
This command will display detailed JSON output, including network interfaces, IP ranges, and connected containers.
10. How to Add a Static Address
Assigning a static IP address can be necessary for consistent network configurations.
Assigning a Static IP
When running a container, you can assign it a static IP address within a custom network:
podman run -d –network mynetwork –ip 10.88.1.100 ubuntu -c “apt update && apt install -y nginx && nginx -g ‘daemon off;'”
Example Output:
f05c2f18e41b4ef3a76a7b2349db20c10d9f2ff09f8c676eb08e9dc92f87c216
Ensure that the IP address is within the subnet range of your custom network.
11. How to Log On to a Container with
Accessing a container’s shell is often necessary for debugging or managing running applications.
Starting a Container with
If the container image includes , you can start it directly:
podman run -it ubuntu
Example Output:
ruby
root@e87b469f2e45:/#
Accessing a Running Container
To access an already running container:
podman exec -it <container_id>
Replace <container_id> with the actual ID or name of the container.
Example Output:
ruby
root@d2f56a8d1234:/#
What the Hell is Helm? (And Why You Should Care)
If you’re tired of managing 10+ YAML files for every app, Helm is your new best friend. It’s basically the package manager for Kubernetes — like apt or brew — but for deploying apps in your cluster.
Instead of editing raw YAML over and over for each environment (dev, staging, prod), Helm lets you template it, inject dynamic values, and install with a single command.
Why Use Helm?
Here’s the reality:
- You don’t want to maintain 3 sets of YAMLs for each environment.
- You want to roll back fast if something breaks.
- You want to reuse deployments across projects without rewriting.
Helm fixes all that. It gives you:
- Templated YAML (no more copy-paste hell)
- One chart, many environments
- Version control + rollback support
- Easy upgrades with
helm upgrade - Access to thousands of ready-made charts from the community
Real Talk: What’s a Chart?
Think of a chart like a folder of YAML files with variables in it. You install it, pass in your config (values.yaml), and Helm renders the final manifests and applies them to your cluster.
When you install a chart, Helm creates a release — basically, a named instance of the chart running in your cluster.
How to Get Started (No BS)
1. Install Helm
brew install helm       # mac
choco install kubernetes-helm  # windows
sudo snap install helm  # linux
2. Create Your First Chart
helm create myapp
Boom — you now have a scaffolded chart in a folder with templates, a values file, and everything else you need.
Folder Breakdown
myapp/
├── Chart.yaml         # Metadata
├── values.yaml        # Config you can override
└── templates/         # All your actual Kubernetes YAMLs (as templates)
Example Template (deployment.yaml)
apiVersion: apps/v1
kind: Deployment
metadata:
  name: {{ .Release.Name }}-app
spec:
  replicas: {{ .Values.replicaCount }}
  selector:
    matchLabels:
      app: {{ .Chart.Name }}
  template:
    metadata:
      labels:
        app: {{ .Chart.Name }}
    spec:
      containers:
      - name: {{ .Chart.Name }}
        image: "{{ .Values.image.repository }}:{{ .Values.image.tag }}"
        ports:
        - containerPort: 80
Example values.yaml
replicaCount: 3
image:
  repository: nginx
  tag: latest
Change the values, re-deploy, and you’re done.
Deploying to Your Cluster
helm install my-release ./myapp
Upgrading later?
helm upgrade my-release ./myapp -f prod-values.yaml
Roll it back?
helm rollback my-release 1
Uninstall it?
helm uninstall my-release
Simple. Clean. Versioned.
Want a Database?
Don’t write your own MySQL config. Just pull it from Bitnami’s chart repo:
helm repo add bitnami https://charts.bitnami.com/bitnami
helm install my-db bitnami/mysql
Done.
Helm lets you:
- Turn your Kubernetes YAML into reusable templates
- Manage config per environment without duplicating files
- Version your deployments and roll back instantly
- Install apps like MySQL, Redis, etc., with one command
It’s the smart way to scale your Kubernetes setup without losing your mind.
How to renable the tempurl in latest Cpanel
As some of you have noticed the new cpanel by default has a bunch of new default settings that nobody likes.
FTPserver is not configured out of the box.
TempURL is disabled for security reasons. Under certain conditions, a user can attack another user’s account if they access a malicious script through a mod_userdir URL.
So they removed it by default.
They did not provide instructions for people who need it. You can easily enable it BUT php wont work on the temp url unless you do the following
remove below: and by remove I mean you need to recompile easyapache 4 the following changes.
mod_ruid2
mod_passenger
mod_mpm_itk
mod_proxy_fcgi
mod_fcgid
Install
Mod_suexec
mod_suphp
Then go into Apache_mode_user dir tweak and enable it and exclude default host only.
It wont save the setting in the portal, but the configuration is updated. If you go back and look it will look like the settings didnt take. Looks like a bug in cpanel they need to fix on their front end.
Then PHP will work again on the tempurl.
How to integrate VROPS with Ansible
Automating VMware vRealize Operations (vROps) with Ansible
In the world of IT operations, automation is the key to efficiency and consistency. VMware’s vRealize Operations (vROps) provides powerful monitoring and management capabilities for virtualized environments. Integrating vROps with Ansible, an open-source automation tool, can take your infrastructure management to the next level. In this blog post, we’ll explore how to achieve this integration and demonstrate its benefits with a practical example.
What is vRealize Operations (vROps)?
vRealize Operations (vROps) is a comprehensive monitoring and analytics solution from VMware. It helps IT administrators manage the performance, capacity, and overall health of their virtual environments. Key features of vROps include:
Why Integrate vROps with Ansible?
Integrating vROps with Ansible allows you to automate routine tasks, enforce consistent configurations, and rapidly respond to changes or issues in your virtual environment. This integration enables you to:
Setting Up the Integration
Prerequisites
Before you start, ensure you have:
Step-by-Step Guide
Step 1: Configure API Access in vROps
First, ensure you have the necessary API access in vROps. You’ll need:
Step 2: Install Ansible
If you haven’t installed Ansible yet, you can do so by following these commands:
sh
sudo apt update
sudo apt install ansible
Step 3: Create an Ansible Playbook
Create an Ansible playbook to interact with vROps. Below is an example playbook that retrieves the status of vROps resources.
Note: to use the other api end points you will need to acquire the token and set it as a fact to pass later.
Example
—
—
If you want to acquire the auth token:
—
– name: Authenticate with vROps and Check vROps Status
hosts: localhost
vars:
vrops_host: “your-vrops-host”
vrops_username: “your-username”
vrops_password: “your-password”
tasks:
– name: Authenticate with vROps
uri:
url: “https://{{ vrops_host }}/suite-api/api/auth/token/acquire”
method: POST
body_format: json
body:
username: “{{ vrops_username }}”
password: “{{ vrops_password }}”
headers:
Content-Type: “application/json“
validate_certs: no
register: auth_response
– name: Fail if authentication failed
fail:
msg: “Authentication with vROps failed: {{ auth_response.json }}”
when: auth_response.status != 200
– name: Set auth token as fact
set_fact:
auth_token: “{{ auth_response.json.token }}”
– name: Get vROps status
uri:
url: “https://{{ vrops_host }}/suite-api/api/resources”
method: GET
headers:
Authorization: “vRealizeOpsToken {{ auth_token }}”
Content-Type: “application/json“
validate_certs: no
register: vrops_response
– name: Display vROps status
debug:
msg: “vROps response: {{ vrops_response.json }}”
Save this playbook to a file, for example, check_vrops_status.yml.
Step 4: Define Variables
Create a variables file to store your vROps credentials and host information.
Save it as vars.yml:
vrops_host: your-vrops-host
vrops_username: your-username
vrops_password: your-password
Step 5: Run the Playbook
Execute the playbook using the following command:
sh
ansible-playbook -e @vars.yml check_vrops_status.yml
This above command runs the playbook and retrieves the status of vROps resources, displaying the results if you used the first example.
Here are some of the key API functions you can use:
The Authentication to use the endpoints listed below, you will need to acquire the auth token and set it as a fact to pass to other tasks inside ansible to use with the various endpoints below.
Resource Management
Metrics and Data
Alerts and Notifications
Policies and Configurations
Dashboards and Reports
Capacity and Utilization
Additional Functionalities
These are just a few examples of the many functions available through the vROps REST API.
More Cheat Sheet for DevOps Engineers
This guide is focused entirely on the most commonly used Kubernetes YAML examples and why you’d use them in a production or staging environment. These YAML definitions act as the foundation for automating, scaling, and managing containerized workloads.
1. Pod YAML (Basic Unit of Execution)
Use this when you want to run a single container on the cluster.
apiVersion: v1
kind: Pod
metadata:
  name: simple-pod
spec:
  containers:
  - name: nginx
    image: nginx
This is the most basic unit in Kubernetes. Ideal for testing and debugging.
2. Deployment YAML (For Scaling and Updates)
Use deployments to manage stateless apps with rolling updates and replicas.
apiVersion: apps/v1
kind: Deployment
metadata:
  name: web-deployment
spec:
  replicas: 3
  selector:
    matchLabels:
      app: web
  template:
    metadata:
      labels:
        app: web
    spec:
      containers:
      - name: nginx
        image: nginx:1.21
3. Production-Ready Deployment Example
Use this to deploy a resilient application with health checks and resource limits.
apiVersion: apps/v1
kind: Deployment
metadata:
  name: production-app
  labels:
    app: myapp
spec:
  replicas: 4
  selector:
    matchLabels:
      app: myapp
  template:
    metadata:
      labels:
        app: myapp
    spec:
      containers:
      - name: myapp-container
        image: myorg/myapp:2.1.0
        ports:
        - containerPort: 80
        livenessProbe:
          httpGet:
            path: /healthz
            port: 80
          initialDelaySeconds: 15
          periodSeconds: 20
        readinessProbe:
          httpGet:
            path: /ready
            port: 80
          initialDelaySeconds: 5
          periodSeconds: 10
        resources:
          requests:
            cpu: "250m"
            memory: "512Mi"
          limits:
            cpu: "500m"
            memory: "1Gi"
4. Service YAML (Stable Networking Access)
apiVersion: v1
kind: Service
metadata:
  name: web-service
spec:
  selector:
    app: web
  ports:
  - port: 80
    targetPort: 80
  type: ClusterIP
5. ConfigMap YAML (External Configuration)
apiVersion: v1
kind: ConfigMap
metadata:
  name: app-config
data:
  LOG_LEVEL: "debug"
  FEATURE_FLAG: "true"
6. Secret YAML (Sensitive Information)
apiVersion: v1
kind: Secret
metadata:
  name: app-secret
stringData:
  password: supersecret123
7. PersistentVolumeClaim YAML (For Storage)
apiVersion: v1
kind: PersistentVolumeClaim
metadata:
  name: app-pvc
spec:
  accessModes:
    - ReadWriteOnce
  resources:
    requests:
      storage: 1Gi
8. Job YAML (Run Once Tasks)
apiVersion: batch/v1
kind: Job
metadata:
  name: hello-job
spec:
  template:
    spec:
      containers:
      - name: hello
        image: busybox
        command: ["echo", "Hello World"]
      restartPolicy: Never
9. CronJob YAML (Recurring Tasks)
apiVersion: batch/v1
kind: CronJob
metadata:
  name: scheduled-task
spec:
  schedule: "*/5 * * * *"
  jobTemplate:
    spec:
      template:
        spec:
          containers:
          - name: task
            image: busybox
            args: ["/bin/sh", "-c", "echo Scheduled Job"]
          restartPolicy: OnFailure
10. Ingress YAML (Routing External Traffic)
apiVersion: networking.k8s.io/v1
kind: Ingress
metadata:
  name: web-ingress
  annotations:
    nginx.ingress.kubernetes.io/rewrite-target: /
spec:
  rules:
  - host: myapp.example.com
    http:
      paths:
      - path: /
        pathType: Prefix
        backend:
          service:
            name: web-service
            port:
              number: 80
11. NetworkPolicy YAML (Security Control)
apiVersion: networking.k8s.io/v1
kind: NetworkPolicy
metadata:
  name: allow-nginx
spec:
  podSelector:
    matchLabels:
      app: nginx
  policyTypes:
  - Ingress
  ingress:
  - from:
    - podSelector:
        matchLabels:
          app: frontend
Cheat Sheet for DevOps Engineers
Managing Kubernetes clusters efficiently requires fluency with kubectl, the command-line interface for interacting with the Kubernetes API. Whether you’re deploying applications, viewing logs, or debugging infrastructure, this tool is your gateway to smooth cluster operations.
This in-depth cheat sheet will give you a comprehensive reference of how to use kubectl effectively in real-world operations, including advanced flags, filtering tricks, rolling updates, patching, output formatting, and resource exploration.
Shell Autocompletion
Boost productivity with shell autocompletion for kubectl:
Bash
source <(kubectl completion bash)
echo "source <(kubectl completion bash)" >> ~/.bashrc
ZSH
source <(kubectl completion zsh)
echo '[[ $commands[kubectl] ]] && source <(kubectl completion zsh)' >> ~/.zshrc
Aliases
alias k=kubectl
complete -o default -F __start_kubectl k
Working with Contexts & Clusters
kubectl config view                        # Show merged config
kubectl config get-contexts               # List contexts
kubectl config current-context            # Show current context
kubectl config use-context my-context     # Switch to context
Set default namespace for future commands:
kubectl config set-context --current --namespace=my-namespaceDeployments & YAML Management
kubectl apply -f ./manifest.yaml          # Apply resource(s)
kubectl apply -f ./dir/                   # Apply all YAMLs in directory
kubectl create deployment nginx --image=nginx
kubectl explain pod                       # Show pod schema
Apply resources from multiple sources:
kubectl apply -f ./one.yaml -f ./two.yaml
kubectl apply -f https://example.com/config.yaml
Viewing & Finding Resources
kubectl get pods                          # List all pods
kubectl get pods -o wide                  # Detailed pod listing
kubectl get services                      # List services
kubectl describe pod my-pod               # Detailed pod info
Filter & sort:
kubectl get pods --field-selector=status.phase=Running
kubectl get pods --sort-by='.status.containerStatuses[0].restartCount'
Find pod labels:
kubectl get pods --show-labelsUpdating & Rolling Deployments
kubectl set image deployment/web nginx=nginx:1.19       # Set new image
kubectl rollout status deployment/web                   # Watch rollout
kubectl rollout history deployment/web                  # Show revisions
kubectl rollout undo deployment/web                     # Undo last change
kubectl rollout undo deployment/web --to-revision=2     # Revert to specific
Editing, Scaling, Deleting
kubectl edit deployment/web                    # Live edit YAML
kubectl scale deployment/web --replicas=5      # Scale up/down
kubectl delete pod my-pod                      # Delete by name
kubectl delete -f pod.yaml                     # Delete from file
Logs, Execs & Debugging
kubectl logs my-pod                            # View logs
kubectl logs my-pod -c container-name          # Logs from container
kubectl logs my-pod --previous                 # Logs from crashed
kubectl exec my-pod -- ls /                    # Run command
kubectl exec -it my-pod -- bash                # Shell access
Working with Services
kubectl expose pod nginx --port=80 --target-port=8080   # Create service
kubectl port-forward svc/my-service 8080:80             # Forward to local
Resource Metrics
kubectl top pod                              # Pod metrics
kubectl top pod --sort-by=cpu                # Sort by CPU
kubectl top node                             # Node metrics
Patching Resources
Strategic merge patch:
kubectl patch deployment my-deploy -p '{"spec":{"replicas":4}}'JSON patch with array targeting:
kubectl patch pod my-pod --type='json' -p='[
  {"op": "replace", "path": "/spec/containers/0/image", "value":"nginx:1.21"}
]'
Cluster & Node Management
kubectl cordon my-node                        # Prevent new pods
kubectl drain my-node                         # Evict pods for maintenance
kubectl uncordon my-node                      # Resume scheduling
kubectl get nodes                             # List all nodes
kubectl describe node my-node                 # Node details
Output Formatting
kubectl get pods -o json
kubectl get pods -o yaml
kubectl get pods -o custom-columns="NAME:.metadata.name,IMAGE:.spec.containers[*].image"
Exploring API Resources
kubectl api-resources                         # List all resources
kubectl api-resources --namespaced=false      # Non-namespaced
kubectl api-resources -o wide                 # Extended info
Logging & Verbosity
kubectl get pods -v=6                         # Debug output
kubectl get deployment -v=9                   # Full API trace
Deployment Template Example
apiVersion: apps/v1
kind: Deployment
metadata:
  name: nginx-deployment
  namespace: my-namespace
spec:
  replicas: 3
  selector:
    matchLabels:
      app: nginx
  template:
    metadata:
      labels:
        app: nginx
    spec:
      containers:
      - name: nginx
        image: nginx:latest
        ports:
- containerPort: 80How to Power Up or Power Down multiple instances in OCI using CLI with Ansible
Now the reason why you would probably want this is over terraform is because terraform is more suited for infrastructure orchestration and not really suited to deal with the instances once they are up and running.
If you have scaled servers out in OCI powering servers up and down in bulk currently is not available. If you are doing a migration or using a staging environment that you need need to use the machine when building or doing troubleshooting.
Then having a way to power up/down multiple machines at once is convenient.
Install the OCI collections if you don’t have it already.
Linux/macOS
curl -L https://raw.githubusercontent.com/oracle/oci-ansible-collection/master/scripts/install.sh | bash -s — —verbose
ansible-galaxy collection list – Will list the collections installed
# /path/to/ansible/collections
Collection Version
——————- ——-
amazon.aws 1.4.0
ansible.builtin 1.3.0
ansible.posix 1.3.0
oracle.oci 2.10.0
Once you have it installed you need to test the OCI client is working
oci iam compartment list –all (this will list out the compartment ID list for your instances.
Compartments in OCI are a way to organise infrastructure and control access to those resources. This is great for if you have contractors coming and you only want them to have access to certain things not everything.
Now there are two ways you can your instance names.
Bash Script to get the instances names from OCI
compartment_id=“ocid1.compartment.oc1..insert compartment ID here“
# Explicitly define the availability domains based on your provided data
availability_domains=(“zcLB:US-CHICAGO-1-AD-1” “zcLB:US-CHICAGO-1-AD-2” “zcLB:US-CHICAGO-1-AD-3”)
# For each availability domain, list the instances
for ad in “${availability_domains[@]}”; do
# List instances within the specific AD and compartment, extracting the “id” field
oci compute instance list –compartment-id $compartment_id –availability-domain $ad –query “data[].id” –raw-output > instance_ids.txt
# Clean up the instance IDs (removing brackets, quotes, etc.)
sed –i ‘s/\[//g’ instance_ids.txt
sed –i ‘s/\]//g’ instance_ids.txt
sed –i ‘s/”//g’ instance_ids.txt
sed –i ‘s/,//g’ instance_ids.txt
# Read each instance ID from instance_ids.txt
while read -r instance_id; do
# Get instance VNIC information
instance_info=$(oci compute instance list-vnics –instance-id “$instance_id“)
# Extract the required fields and print them
display_name=$(echo “$instance_info“ | jq -r ‘.data[0].”display-name”‘)
public_ip=$(echo “$instance_info“ | jq -r ‘.data[0].”public-ip“‘)
private_ip=$(echo “$instance_info“ | jq -r ‘.data[0].”private-ip“‘)
echo “Availability Domain: $ad“
echo “Display Name: $display_name“
echo “Public IP: $public_ip“
echo “Private IP: $private_ip“
echo “—————————————–“
done < instance_ids.txt
done
The output of the script when piped in to a file will look like
Instance.names
Availability Domain: zcLB:US-CHICAGO-1-AD-1
Display Name: Instance1
Public IP: 192.0.2.1
Private IP: 10.0.0.1
—————————————–
Availability Domain: zcLB:US-CHICAGO-1-AD-1
Display Name: Instance2
Public IP: 192.0.2.2
Private IP: 10.0.0.2
—————————————–
…
You can now grep this file for the name of the servers you want to power on or off quickly
Now we have an ansible playbook that can power on or power off the instance by name provided by the OCI client
Ansible playbook to power on or off multiple instances via OCI CLI
—
– name: Control OCI Instance Power State based on Instance Names
hosts: localhost
vars:
instance_names_to_stop:
– instance1
# Add more instance names here if you wish to stop them…
instance_names_to_start:
# List the instance names you wish to start here…
# Example:
– Instance2
tasks:
– name: Fetch all instance details in the compartment
command:
cmd: “oci compute instance list –compartment-id ocid1.compartment.oc1..aaaaaaaak7jc7tn2su2oqzmrbujpr5wmnuucj4mwj4o4g7rqlzemy4yvxrza –output json“
register: oci_output
– set_fact:
instances: “{{ oci_output.stdout | from_json }}”
– name: Extract relevant information
set_fact:
clean_instances: “{{ clean_instances | default([]) + [{ ‘name’: item[‘display-name’], ‘id’: item.id, ‘state’: item[‘lifecycle-state’] }] }}”
loop: “{{ instances.data }}”
when: “‘display-name’ in item and ‘id’ in item and ‘lifecycle-state’ in item”
– name: Filter out instances to stop
set_fact:
instances_to_stop: “{{ instances_to_stop | default([]) + [item] }}”
loop: “{{ clean_instances }}”
when: “item.name in instance_names_to_stop and item.state == ‘RUNNING'”
– name: Filter out instances to start
set_fact:
instances_to_start: “{{ instances_to_start | default([]) + [item] }}”
loop: “{{ clean_instances }}”
when: “item.name in instance_names_to_start and item.state == ‘STOPPED'”
– name: Filter out instances to stop
set_fact:
instances_to_stop: “{{ clean_instances | selectattr(‘name’, ‘in’, instance_names_to_stop) | selectattr(‘state’, ‘equalto‘, ‘RUNNING’) | list }}”
– name: Filter out instances to start
set_fact:
instances_to_start: “{{ clean_instances | selectattr(‘name’, ‘in’, instance_names_to_start) | selectattr(‘state’, ‘equalto‘, ‘STOPPED’) | list }}”
– name: Display instances to stop (you can remove this debug task later)
debug:
var: instances_to_stop
– name: Display instances to start (you can remove this debug task later)
debug:
var: instances_to_start
– name: Power off instances
command:
cmd: “oci compute instance action —action STOP –instance-id {{ item.id }}”
loop: “{{ instances_to_stop }}”
when: instances_to_stop | length > 0
register: state
# – debug:
# var: state
– name: Power on instances
command:
cmd: “oci compute instance action —action START –instance-id {{ item.id }}”
loop: “{{ instances_to_start }}”
when: instances_to_start | length > 0
The output will look like
PLAY [Control OCI Instance Power State based on Instance Names] **********************************************************************************
TASK [Gathering Facts] ***************************************************************************************************************************
ok: [localhost]
TASK [Fetch all instance details in the compartment] *********************************************************************************************
changed: [localhost]
TASK [Parse the OCI CLI output] ******************************************************************************************************************
ok: [localhost]
TASK [Extract relevant information] **************************************************************************************************************
ok: [localhost] => (item={‘display-name’: ‘Instance1’, ‘id’: ‘ocid1.instance.oc1..exampleuniqueID1’, ‘lifecycle-state’: ‘STOPPED’})
ok: [localhost] => (item={‘display-name’: ‘Instance2’, ‘id’: ‘ocid1.instance.oc1..exampleuniqueID2’, ‘lifecycle-state’: ‘RUNNING’})
TASK [Filter out instances to stop] **************************************************************************************************************
ok: [localhost]
TASK [Filter out instances to start] *************************************************************************************************************
ok: [localhost]
TASK [Display instances to stop (you can remove this debug task later)] **************************************************************************
ok: [localhost] => {
“instances_to_stop“: [
{
“name”: “Instance2”,
“id”: “ocid1.instance.oc1..exampleuniqueID2″,
“state”: “RUNNING”
}
]
}
TASK [Display instances to start (you can remove this debug task later)] *************************************************************************
ok: [localhost] => {
“instances_to_start“: [
{
“name”: “Instance1”,
“id”: “ocid1.instance.oc1..exampleuniqueID1″,
“state”: “STOPPED”
}
]
}
TASK [Power off instances] ***********************************************************************************************************************
changed: [localhost] => (item={‘name’: ‘Instance2’, ‘id’: ‘ocid1.instance.oc1..exampleuniqueID2’, ‘state’: ‘RUNNING’})
TASK [Power on instances] ************************************************************************************************************************
changed: [localhost] => (item={‘name’: ‘Instance1’, ‘id’: ‘ocid1.instance.oc1..exampleuniqueID1’, ‘state’: ‘STOPPED’})
PLAY RECAP ****************************************************************************************************************************************
localhost : ok=9 changed=3 unreachable=0 failed=0 skipped=0 rescued=0 ignored=0
How to Deploy Another VPC in AWS with Scalable EC2’s for HA using Terraform
So we are going to do this a bit different than the other post. As the other post is just deploying one instance in an existing VPC.
This one is more fun. The structure we will use this time will allow you to scale your ec2 instances very cleanly. If you are using git repos to push out changes. Then having a main.tf for your instance is much simpler to manage at scale.
File structure:
terraform-project/
├── main.tf <– Your main configuration file
├── variables.tf <– Variables file that has the inputs to pass
├── outputs.tf <– Outputs file
├── security_group.tf <– File containing security group rules
└── modules/
└── instance/
├── main.tf <- this file contains your ec2 instances
└── variables.tf <- variable file that defines we will pass for the module in main.tf to use
Explaining the process:
Main.tf
provider “aws“ {
region = “us-west-2”
}
resource “aws_key_pair“ “my-nick-test-key” {
key_name = “my-nick-test-key”
public_key = file(“${path.module}/terraform-aws-key.pub”)
}
resource “aws_vpc“ “vpc2” {
cidr_block = “10.0.0.0/16”
}
resource “aws_subnet“ “newsubnet“ {
vpc_id = aws_vpc.vpc2.id
cidr_block = “10.0.1.0/24”
map_public_ip_on_launch = true
}
module “web_server“ {
source = “./module/instance”
ami_id = var.ami_id
instance_type = var.instance_type
key_name = var.key_name_instance
subnet_id = aws_subnet.newsubnet.id
instance_count = 2 // Specify the number of instances you want
security_group_id = aws_security_group.newcpanel.id
}
Variables.tf
variable “ami_id“ {
description = “The AMI ID for the instance”
default = “ami-0913c47048d853921” // Amazon Linux 2 AMI ID
}
variable “instance_type“ {
description = “The instance type for the instance”
default = “t2.micro“
}
variable “key_name_instance“ {
description = “The key pair name for the instance”
default = “my-nick-test-key”
}
Security_group.tf
resource “aws_security_group“ “newcpanel“ {
name = “newcpanel“
description = “Allow inbound traffic”
vpc_id = aws_vpc.vpc2.id
// POP3 TCP 110
ingress {
from_port = 110
to_port = 110
protocol = “tcp“
cidr_blocks = [“0.0.0.0/0”]
}
// Custom TCP 20
ingress {
from_port = 20
to_port = 20
protocol = “tcp“
cidr_blocks = [“0.0.0.0/0”]
}
// Custom TCP 587
ingress {
from_port = 587
to_port = 587
protocol = “tcp“
cidr_blocks = [“0.0.0.0/0”]
}
// DNS (TCP) TCP 53
ingress {
from_port = 53
to_port = 53
protocol = “tcp“
cidr_blocks = [“0.0.0.0/0”]
}
// SMTPS TCP 465
ingress {
from_port = 465
to_port = 465
protocol = “tcp“
cidr_blocks = [“0.0.0.0/0”]
}
// HTTPS TCP 443
ingress {
from_port = 443
to_port = 443
protocol = “tcp“
cidr_blocks = [“0.0.0.0/0”]
}
// DNS (UDP) UDP 53
ingress {
from_port = 53
to_port = 53
protocol = “udp“
cidr_blocks = [“0.0.0.0/0”]
}
// IMAP TCP 143
ingress {
from_port = 143
to_port = 143
protocol = “tcp“
cidr_blocks = [“0.0.0.0/0”]
}
// IMAPS TCP 993
ingress {
from_port = 993
to_port = 993
protocol = “tcp“
cidr_blocks = [“0.0.0.0/0”]
}
// Custom TCP 21
ingress {
from_port = 21
to_port = 21
protocol = “tcp“
cidr_blocks = [“0.0.0.0/0”]
}
// Custom TCP 2086
ingress {
from_port = 2086
to_port = 2086
protocol = “tcp“
cidr_blocks = [“0.0.0.0/0”]
}
// Custom TCP 2096
ingress {
from_port = 2096
to_port = 2096
protocol = “tcp“
cidr_blocks = [“0.0.0.0/0”]
}
// HTTP TCP 80
ingress {
from_port = 80
to_port = 80
protocol = “tcp“
cidr_blocks = [“0.0.0.0/0”]
}
// SSH TCP 22
ingress {
from_port = 22
to_port = 22
protocol = “tcp“
cidr_blocks = [“0.0.0.0/0”]
}
// POP3S TCP 995
ingress {
from_port = 995
to_port = 995
protocol = “tcp“
cidr_blocks = [“0.0.0.0/0”]
}
// Custom TCP 2083
ingress {
from_port = 2083
to_port = 2083
protocol = “tcp“
cidr_blocks = [“0.0.0.0/0”]
}
// Custom TCP 2087
ingress {
from_port = 2087
to_port = 2087
protocol = “tcp“
cidr_blocks = [“0.0.0.0/0”]
}
// Custom TCP 2095
ingress {
from_port = 2095
to_port = 2095
protocol = “tcp“
cidr_blocks = [“0.0.0.0/0”]
}
// Custom TCP 2082
ingress {
from_port = 2082
to_port = 2082
protocol = “tcp“
cidr_blocks = [“0.0.0.0/0”]
}
}
output “newcpanel_sg_id“ {
value = aws_security_group.newcpanel.id
description = “The ID of the security group ‘newcpanel‘”
}
Outputs.tf
output “public_ips“ {
value = module.web_server.public_ips
description = “List of public IP addresses for the instances.”
}
Okay so now we want to create the scalable ec2
We create a modules/instance directory and inside here define the instances as resources
modules/instance/main.tf
resource “aws_instance“ “Tailor-Server” {
count = var.instance_count // Control the number of instances with a variable
ami = var.ami_id
instance_type = var.instance_type
subnet_id = var.subnet_id
key_name = var.key_name
vpc_security_group_ids = [var.security_group_id]
tags = {
Name = format(“Tailor-Server%02d”, count.index + 1) // Naming instances with a sequential number
}
root_block_device {
volume_type = “gp2”
volume_size = 30
delete_on_termination = true
}
}
Modules/instance/variables.tf
Each variable serves as an input that can be set externally when the module is called, allowing for flexibility and reusability of the module across different environments or scenarios.
So here we defining it as a list of items we need to pass for the module to work. We will later provide the actual parameter to pass to the variables being called in the main.tf
Cheat sheet:
ami_id: Specifies the Amazon Machine Image (AMI) ID that will be used to launch the EC2 instances. The AMI determines the operating system and software configurations that will be loaded onto the instances when they are created.
instance_type: Determines the type of EC2 instance to launch. This affects the computing resources available to the instance (CPU, memory, etc.).
Type: It is expected to be a string that matches one of AWS’s predefined instance types (e.g., t2.micro, m5.large).
key_name: Specifies the name of the key pair to be used for SSH access to the EC2 instances. This key should already exist in the AWS account.
subnet_id: Identifies the subnet within which the EC2 instances will be launched. The subnet is part of a specific VPC (Virtual Private Cloud).
instance_names: A list of names to be assigned to the instances. This helps in identifying the instances within the AWS console or when querying using the AWS CLI.
security_group_Id: Specifies the ID of the security group to attach to the EC2 instances. Security groups act as a virtual firewall for your instances to control inbound and outbound traffic.
variable “ami_id“ {}
variable “instance_type“ {}
variable “key_name“ {}
variable “subnet_id“ {}
variable “instance_names“ {
type = list(string)
description = “List of names for the instances to create.”
}
variable “security_group_id“ {
description = “Security group ID to assign to the instance”
type = string
}
variable “instance_count“ {
description = “The number of instances to create”
type = number
default = 1 // Default to one instance if not specified
}
Time to deploy your code: I didnt bother showing the plan here just the apply
my-terraform-vpc$ terraform apply
Do you want to perform these actions?
Terraform will perform the actions described above.
Only ‘yes’ will be accepted to approve.
Enter a value: yes
aws_subnet.newsubnet: Destroying… [id=subnet-016181a8999a58cb4]
aws_subnet.newsubnet: Destruction complete after 1s
aws_subnet.newsubnet: Creating…
aws_subnet.newsubnet: Still creating… [10s elapsed]
aws_subnet.newsubnet: Creation complete after 11s [id=subnet-0a5914443d2944510]
module.web_server.aws_instance.Tailor-Server[1]: Creating…
module.web_server.aws_instance.Tailor-Server[0]: Creating…
module.web_server.aws_instance.Tailor-Server[1]: Still creating… [10s elapsed]
module.web_server.aws_instance.Tailor-Server[0]: Still creating… [10s elapsed]
module.web_server.aws_instance.Tailor-Server[0]: Still creating… [20s elapsed]
module.web_server.aws_instance.Tailor-Server[1]: Still creating… [20s elapsed]
module.web_server.aws_instance.Tailor-Server[1]: Still creating… [30s elapsed]
module.web_server.aws_instance.Tailor-Server[0]: Still creating… [30s elapsed]
module.web_server.aws_instance.Tailor-Server[0]: Still creating… [40s elapsed]
module.web_server.aws_instance.Tailor-Server[1]: Still creating… [40s elapsed]
module.web_server.aws_instance.Tailor-Server[1]: Still creating… [50s elapsed]
module.web_server.aws_instance.Tailor-Server[0]: Still creating… [50s elapsed]
module.web_server.aws_instance.Tailor-Server[0]: Creation complete after 52s [id=i-0d103937dcd1ce080]
module.web_server.aws_instance.Tailor-Server[1]: Still creating… [1m0s elapsed]
module.web_server.aws_instance.Tailor-Server[1]: Still creating… [1m10s elapsed]
module.web_server.aws_instance.Tailor-Server[1]: Creation complete after 1m12s [id=i-071bac658ce51d415]
Apply complete! Resources: 3 added, 0 changed, 1 destroyed.
Outputs:
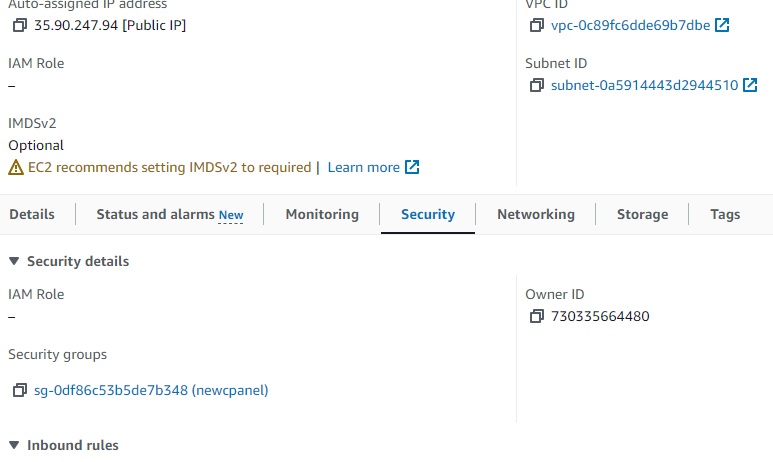
newcpanel_sg_id = “sg-0df86c53b5de7b348”
public_ips = [
“34.219.34.165”,
“35.90.247.94”,
]
Results:
VPC successful:

EC2 successful:

Security-Groups:


Key Pairs:

Ec2 assigned SG group: