
Category: Centos
SMTP auth relay with postfix
In case that your SMTP server has authentication (like Gmail), For this purpose we will use Postfix. I
Install the needed packages:
Ubuntu
apt-get install postfix mailutils libsasl2-2 ca-certificates libsasl2-modules
CentOS
yum update && yum install postfix mailx cyrus-sasl cyrus-sasl-plain
- Set Postfix config file /etc/postfix/main.cf. Add this lines to the end of the file:
-
Set Postfix config file
/etc/postfix/main.cf. Add this lines to the end of the file:Ubuntu
relayhost = [smtp.gmail.com]:587
smtp_sasl_auth_enable = yes
smtp_sasl_password_maps = hash:/etc/postfix/sasl_passwd
smtp_sasl_security_options = noanonymous
smtp_tls_CAfile = /etc/ssl/certs/thawte_Primary_Root_CA.pem
smtp_use_tls = yes
CentOS
relayhost = [smtp.gmail.com]:587
smtp_sasl_auth_enable = yes
smtp_sasl_password_maps = hash:/etc/postfix/sasl_passwd
smtp_sasl_security_options = noanonymous
smtp_tls_CAfile = /etc/ssl/certs/ca-bundle.crt
smtp_use_tls = yes
-
Configure email address and password:
echo [smtp.gmail.com]:587 USERNAME@gmail.com:PASSWORD > /etc/postfix/sasl_passwd
postmap /etc/postfix/sasl_passwd
chmod 400 /etc/postfix/sasl_passwd
-
Secure DB password
chown root:root /etc/postfix/sasl_passwd /etc/postfix/sasl_passwd.db
chmod 0600 /etc/postfix/sasl_passwd /etc/postfix/sasl_passwd.db
-
Reload Postfix
systemctl reload postfix
-
Test you configuration with:
echo "Test mail from postfix" | mail -s "Test Postfix" you@example.com
echo "Test mail from postfix" | mail -s "Test Postfix" -r someone@whatever.com you@example.com (this is if your reply address has to come from a specific sender)
You should receive an email on
you@example.com
You should receive an email on you@example.com
Note: If you are using centos 7, which uses systemD. You will find that postfix doesn’t send maillogs to /var/log/maillog. Someone decided it would be a great idea to send it to the journaler instead.
In order to find your mail logs and or tail the logs for postfix.
- Journalctl -u postfix (view all logs)
- Journalctl -u postfix -f (to tail the mail logs)
How to properly upgrade wazuh with a major update (standalone setup)
Upgrade from the same major version (3.x)
The following steps show how to upgrade to the latest available version of Wazuh 3.x (which implies upgrading to the latest version of Elastic Stack 6.x).
Starting the upgrade
If you followed our manager or agents installation guides, probably you disabled the repository in order to avoid undesired upgrades. It’s necessary to enable them again to get the last packages.
- For CentOS/RHEL/Fedora:
#sed –i“s/^enabled=0/enabled=1/” /etc/yum.repos.d/wazuh.repo
Upgrade the Wazuh manager
Note
Since Wazuh v3.7.0 the File Integrity Monitoring database is not used anymore. In order to add to Wazuh DB the file and registry entries stored from previous versions it’s necessary to run the FIM migration tool.
- Upgrade the wazuh-manager package:
- For CentOS/RHEL/Fedora:
# yum upgrade wazuh-manager
- Upgrade the wazuh-api package:
- For CentOS/RHEL/Fedora:
# yum upgrade wazuh-api
Note
The installation of the updated packages will automatically restart the services for the Wazuh manager, API and agents. Your Wazuh config file will keep unmodified, so you’ll need to manually add the settings for the new capabilities. Check the User Manual for more information.
Finishing the Wazuh upgrade
You’ve finished upgrading your Wazuh installation to the latest version. Now you can disable again the Wazuh repositories in order to avoid undesired upgrades and compatibility issues.
- For CentOS/RHEL/Fedora:
#sed –i“s/^enabled=1/enabled=0/” /etc/yum.repos.d/wazuh.repo
Upgrade to the latest Elastic Stack version
Since the release of Wazuh 3.0.0, there’s been several updates to the 6.x version of the Elastic Stack, introducing several bugfixes and important changes. In order to use the latest version of Wazuh, it’s necessary to install the latest compatible Elastic Stack packages.
- Stop the services:
#systemctl stop filebeat (This you do not need to stop in a standalone setup, because it should not be installed. Filebeat is only used when you have a clustered setup. It sends logs back to the manager when clustered)
#systemctl stop logstash
#systemctl stop kibana
#systemctl stop elasticsearch
- Enable the Elastic repository:
If you followed our Elastic Stack Installation Guide, probably you disabled the repository in order to avoid undesired upgrades for the Elastic Stack. It’s necessary to enable them again to get the last packages.
- For CentOS/RHEL/Fedora:
#sed –i“s/^enabled=0/enabled=1/” /etc/yum.repos.d/elastic.repo
Upgrade Elasticsearch
- Upgrade the elasticsearch package:
- For CentOS/RHEL/Fedora:
# yum install elasticsearch-6.5.1
- Start the Elasticsearch service:
#systemctl daemon-reload
#systemctlenableelasticsearch.service
#systemctl start elasticsearch.service
It’s important to wait until the Elasticsearch server finishes starting. Check the current status with the following command, which should give you a response like the shown below:
# curl "http://localhost:9200/?pretty"

{
  "name" : "Zr2Shu_",
  "cluster_name" : "elasticsearch",
  "cluster_uuid" : "M-W_RznZRA-CXykh_oJsCQ",
  "version" : {
    "number" : "6.5.1",
    "build_flavor" : "default",
    "build_type" : "rpm",
    "build_hash" : "053779d",
    "build_date" : "2018-07-20T05:20:23.451332Z",
    "build_snapshot" : false,
    "lucene_version" : "7.3.1",
    "minimum_wire_compatibility_version" : "5.6.0",
    "minimum_index_compatibility_version" : "5.0.0"
  },
  "tagline" : "You Know, for Search"
}
Updating the Elasticsearch template to the latest version is mandatory in order to avoid compatibility issues with the latest versions of Wazuh and the Elastic Stack.
# curl https://raw.githubusercontent.com/wazuh/wazuh/3.7/extensions/elasticsearch/wazuh-elastic6-template-alerts.json | curl -X PUT "http://localhost:9200/_template/wazuh" -H 'Content-Type: application/json' -d @-
Upgrade Logstash
- Upgrade the logstash package:
- For CentOS/RHEL/Fedora:
# yum install logstash-6.5.1
- Download and set the Wazuh configuration for Logstash:
- Local configuration:
# cp /etc/logstash/conf.d/01-wazuh.conf /backup_directory/01-wazuh.conf.bak
# curl -so /etc/logstash/conf.d/01-wazuh.conf https://raw.githubusercontent.com/wazuh/wazuh/3.7/extensions/logstash/01-wazuh-local.conf
# usermod -a -G ossec logstash
- Remote configuration: (We are not using this in our standalone setup and therefore do not need to run this)
# cp /etc/logstash/conf.d/01-wazuh.conf /backup_directory/01-wazuh.conf.bak
# curl -so /etc/logstash/conf.d/01-wazuh.conf https://raw.githubusercontent.com/wazuh/wazuh/3.7/extensions/logstash/01-wazuh-remote.conf
- Start the Logstash service:
#systemctl daemon-reload
#systemctlenablelogstash.service
#systemctl start logstash.service
Note
The Logstash configuration file has been replaced for an updated one. If you already configured the encryption between Filebeat and Logstash, don’t forget to check again Setting up SSL for Filebeat and Logstash if you’re using a distributed architecture.
Upgrade Kibana
- Upgrade the kibana package:
- For CentOS/RHEL/Fedora:
# yum install kibana-6.5.1
- Uninstall the Wazuh app from Kibana:
- Update file permissions. This will avoid several errors prior to updating the app:
#chown -R kibana:kibana /usr/share/kibana/optimize
#chown -R kibana:kibana /usr/share/kibana/plugins
- Remove the Wazuh app:
#sudo -u kibana /usr/share/kibana/bin/kibana-plugin remove wazuh
- Upgrade the Wazuh app:
# rm -rf /usr/share/kibana/optimize/bundles
#sudo -u kibanaNODE_OPTIONS=“–max-old-space-size=3072” /usr/share/kibana/bin/kibana-plugin install https://packages.wazuh.com/wazuhapp/wazuhapp-3.7.1_6.5.1.zip
Warning
The Wazuh app installation process may take several minutes. Please wait patiently.
- Start the Kibana service:
#systemctl daemon-reload
#systemctlenablekibana.service
#systemctl start kibana.service
This section only applies if you have clustered/distributed setup
Upgrade Filebeat
- Upgrade the filebeat package:
- For CentOS/RHEL/Fedora:
# yum install filebeat-6.5.1
- Start the Filebeat service:
#systemctl daemon-reload
#systemctlenablefilebeat.service
#systemctl start filebeat.service
Finishing the Elastic Stack upgrade
You’ve finished upgrading your Wazuh installation to the latest version. Now you can disable again the Elastic Stack repositories in order to avoid undesired upgrades and compatibility issues with the Wazuh app.
- For CentOS/RHEL/Fedora:
#sed –i“s/^enabled=1/enabled=0/” /etc/yum.repos.d/elastic.repo
Things you will need to fix after the upgrade
1. Running migration tool for versions before 3.7 for that have upgraded recently:
-
If you upgraded from wazuh 3.6 or newer you will need to run the following migration tool, which migrate the database into a new format for wazuh 3.7When they first introduced the tool it had some fail to exit code if it couldn’t decode a line and it would halt the migration. They have since fixed that, however it look something like this.2018-11-12 15:45:38 [INFO] [32/239] Added 3339 file entries in agent ‘033’ database.
2018-11-12 15:45:38 [INFO] Setting FIM database for agent ‘033’ as completed…
2018-11-12 15:45:38 [INFO] [33/239] Upgrading FIM database for agent ‘034’…
2018-11-12 15:45:38 [INFO] [33/239] Added 61 file entries in agent ‘034’ database.
2018-11-12 15:45:38 [INFO] [33/239] Upgrading FIM database (syscheck-registry) for agent ‘034’…
2018-11-12 15:45:38 [ERROR] Couldn’t decode line at syscheck database.
Traceback (most recent call last):
File “./fim_migrate“, line 320, in <module>
if not check_file_entry(agt[0], decoded[2], s):
File “./fim_migrate“, line 91, in check_file_entry
msg = msg + cfile + b”‘;”
TypeError: cannot concatenate ‘str’ and ‘NoneType‘ objects
working migration tool below
https://raw.githubusercontent.com/wazuh/wazuh/3.7/tools/migration/fim_migrate.py
2. error “api version type mismatch 3.6.1′‘ :
-
After the upgrade when you go into the kibana interface and it does a systems check you might see this error.
Resolution :
- First make sure all the app versions match.
https://documentation.wazuh.com/current/installation-guide/compatibility_matrix/index.html#api-and-kibana-app
- Next run this on the server side to confirm they match
- cat /usr/share/kibana/plugins/wazuh/package.json | grep –i -E “version|revision“
“version”: “3.7.0”,
“revision”: “0413”,
“version”: “6.4.3”
If all those match then you simply need to do the following to fix it.
- Delete the .wazuh-version index:
curl -XDELETE http://elastic_ip:9200/.wazuh-version
- Restart Kibana:
systemctl restart kibana
Wait for about 30 s – 1 min and now open a new window in your browser, then you should navigate without any more troubles regarding the version mismatching.
Notes: The Wazuh app creates that index when you restart Kibana if it’s not present. If your standalone setup is using localhost then the curl command should be localhost and not the elastic ip.
3. Items listed per screen when listing agents will default back to 17 items for screen and is extremely annoying. You will need to fix this in the following manner.:
# systemctl stop kibana
Let’s open the file under /usr/share/kibana/plugins/wazuh/public/templates/agents-prev/agents-prev.html and look for lines 103-109:
<wz-table flex path=“‘/agents'” keys=“[‘id’,{value:’name’,size:2},’ip’,’status’,’group’,’os.name‘,’os.version’,’version’]” allow-click=“true” row-sizes=“[17,15,13]”></wz-table>
The wz-table tag is related to a Wazuh custom directive which has parameters to easy change that limit.
Replace [17,15,13] by your desired size [50,50,50], where each value refers to different screen sizes. Use 50 for all screen sizes,
and you’ll see 50 agents per page regardless your screen size. Use your desired value, it can be 100 or 150…
My suggestion is to don’t increase more than 50 (Angular performance reasons).
Once you are done save and close the file. Now remove old bundles and check the permissions again:
rm –rf /usr/share/kibana/optimize/bundleschown –R kibana:kibana /usr/share/kibana/optimizechown –R kibana:kibana /usr/share/kibana/plugins
Restart Kibana:
# systemctl restart kibana
It takes a few of minutes until it’s completed, you can check the status using the next command:
# systemctl status kibana -l
You’ll see “Optimizing…”, once you see “App ready to be used” you can remove cache/cookies from your browser and type your App address for accessing it.
4. Errors in wazuh log after upgrade [FORBIDDEN/12/index read-only / allow delete (api)];”}:
- If you see the following your wazuh.log
- tail -n500 /usr/share/kibana/optimize/wazuh-logs/wazuhapp.log
{“date”:”2018-11-22T14:24:15.613Z”,”level”:”info”,”location”:”[monitoring][init]”,”message”:”Checking if wazuh-monitoring pattern exists…”}
{“date”:”2018-11-22T14:24:15.625Z”,”level”:”error”,”location”:”[initialize][checkKnownFields]”,”message”:”[cluster_block_exception] blocked by: [FORBIDDEN/12/index read-only / allow delete (api)];”}
{“date”:”2018-11-22T14:24:15.632Z”,”level”:”info”,”location”:”[monitoring][init]”,”message”:”Updating known fields for wazuh-monitoring pattern…”}
{“date”:”2018-11-22T14:24:15.646Z”,”level”:”info”,”location”:”[monitoring][init]”,”message”:”Didn’t find wazuh-monitoring pattern for Kibana v6.x. Proceeding to create it…”}
{“date”:”2018-11-22T14:24:15.650Z”,”level”:”info”,”location”:”[monitoring][createWazuhMonitoring]”,”message”:”No need to delete old wazuh-monitoring pattern.”}
{“date”:”2018-11-22T14:24:15.650Z”,”level”:”info”,”location”:”[monitoring][configureKibana]”,”message”:”Creating index pattern: wazuh-monitoring-3.x-*”}
{“date”:”2018-11-22T14:24:15.658Z”,”level”:”info”,”location”:”[initialize][checkAPIEntriesExtensions]”,”message”:”Successfully updated API entry extensions with ID: 1535484412304″}
{“date”:”2018-11-22T14:24:15.660Z”,”level”:”error”,”location”:”[monitoring][configureKibana]”,”message”:”[cluster_block_exception] blocked by: [FORBIDDEN/12/index read-only / allow delete (api)];”
-
- This usually means that one of your partitions is near full and wazuh goes into read only mode because of this, super annoying…..
To fix this you must :
-
- first add diskspace to your lvm, if you don’t know how to do this look it up…haha 😛
- The you must go into the kibana interface and under under dev tools run the following
- PUT wazuh–monitoring-*/_settings{ “index”: { “blocks”: { “read_only_allow_delete“: “false” } }}
-
- Make sure to restart kibana:
- systemctl restart kibana
Once kibana is restarted the log should look show something like this.
- tail -n500 /usr/share/kibana/optimize/wazuh-logs/wazuhapp.log
{“date”:”2018-11-23T00:00:02.464Z”,”level”:”info”,”location”:”[monitoring][createIndex]”,”message”:”Successfully created today index.”}
Note: Initially you might only see on entry for that day, however after a few days the logs will look like this.
{“date”:”2018-11-22T14:25:09.166Z”,”level”:”error”,”location”:”[monitoring][configureKibana]”,”message”:”[cluster_block_exception] blocked by: [FORBIDDEN/12/index read-only / allow delete (api)];”}
{“date”:”2018-11-23T00:00:02.464Z”,”level”:”info”,”location”:”[monitoring][createIndex]”,”message”:”Successfully created today index.”}
{“date”:”2018-11-24T00:00:01.894Z”,”level”:”info”,”location”:”[monitoring][createIndex]”,”message”:”Successfully created today index.”}
{“date”:”2018-11-25T00:00:02.055Z”,”level”:”info”,”location”:”[monitoring][createIndex]”,”message”:”Successfully created today index.”}
{“date”:”2018-11-26T00:00:01.983Z”,”level”:”info”,”location”:”[monitoring][createIndex]”,”message”:”Successfully created today index.”}
{“date”:”2018-11-27T00:00:02.785Z”,”level”:”info”,”location”:”[monitoring][createIndex]”,”message”:”Successfully created today index.”}
{“date”:”2018-11-28T00:00:02.458Z”,”level”:”info”,”location”:”[monitoring][createIndex]”,”message”:”Successfully created today index.”}
{“date”:”2018-11-29T00:00:02.163Z”,”level”:”info”,”location”:”[monitoring][createIndex]”,”message”:”Successfully created today index.”}
{“date”:”2018-11-29T14:41:46.871Z”,”level”:”info”,”location”:”[initialize]”,”message”:”Kibana index: .kibana“}
{“date”:”2018-11-29T14:41:46.874Z”,”level”:”info”,”location”:”[initialize]”,”message”:”App revision: 0413″}
{“date”:”2018-11-29T14:41:46.874Z”,”level”:”info”,”location”:”[monitoring][configuration]”,”message”:”wazuh.monitoring.enabled: true”}
{“date”:”2018-11-29T14:41:46.874Z”,”level”:”info”,”location”:”[monitoring][configuration]”,”message”:”wazuh.monitoring.frequency: 3600 (0 */60 * * * *) “}
{“date”:”2018-11-29T14:41:46.874Z”,”level”:”info”,”location”:”[monitoring][checkKibanaStatus]”,”message”:”Waiting for Kibana and Elasticsearch servers to be ready…”}
{“date”:”2018-11-29T14:41:48.241Z”,”level”:”info”,”location”:”[initialize][checkWazuhIndex]”,”message”:”Checking .wazuh index.”}
{“date”:”2018-11-29T14:41:48.241Z”,”level”:”info”,”location”:”[initialize][checkWazuhVersionIndex]”,”message”:”Checking .wazuh-version index.”}
{“date”:”2018-11-29T14:41:48.246Z”,”level”:”info”,”location”:”[monitoring][init]”,”message”:”Creating/Updating wazuh-agent template…”}
{“date”:”2018-11-29T14:41:48.246Z”,”level”:”info”,”location”:”[monitoring][checkTemplate]”,”message”:”Updating wazuh-monitoring template…”}
{“date”:”2018-11-29T14:41:48.945Z”,”level”:”info”,”location”:”[initialize][checkKnownFields]”,”message”:”x-pack enabled: no”}
{“date”:”2018-11-29T14:41:48.999Z”,”level”:”info”,”location”:”[initialize][checkKnownFields]”,”message”:”Found 2 index patterns”}
{“date”:”2018-11-29T14:41:48.999Z”,”level”:”info”,”location”:”[initialize][checkKnownFields]”,”message”:”Found 1 valid index patterns for Wazuh alerts”}
{“date”:”2018-11-29T14:41:48.999Z”,”level”:”info”,”location”:”[initialize][checkKnownFields]”,”message”:”Default index pattern found”}
{“date”:”2018-11-29T14:41:48.999Z”,”level”:”info”,”location”:”[initialize][checkKnownFields]”,”message”:”Refreshing known fields for \”index-pattern:wazuh-alerts-3.x-*\””}
{“date”:”2018-11-29T14:41:49.092Z”,”level”:”info”,”location”:”[initialize][checkKnownFields]”,”message”:”App ready to be used.”}
{“date”:”2018-11-29T14:41:49.181Z”,”level”:”info”,”location”:”[initialize][checkAPIEntriesExtensions]”,”message”:”Checking extensions consistency for all API entries”}
{“date”:”2018-11-29T14:41:49.188Z”,”level”:”info”,”location”:”[initialize][checkAPIEntriesExtensions]”,”message”:”Successfully updated API entry extensions with ID: 1535484412304″}
{“date”:”2018-11-29T14:41:49.266Z”,”level”:”info”,”location”:”[monitoring][init]”,”message”:”Creating today index…”}
{“date”:”2018-11-29T14:41:49.295Z”,”level”:”info”,”location”:”[monitoring][init]”,”message”:”Checking if wazuh-monitoring pattern exists…”}
{“date”:”2018-11-29T14:41:49.314Z”,”level”:”info”,”location”:”[monitoring][init]”,”message”:”Updating known fields for wazuh-monitoring pattern…”}
{“date”:”2018-11-29T14:41:49.320Z”,”level”:”info”,”location”:”[monitoring][init]”,”message”:”Skipping wazuh-monitoring pattern creation. Already exists.”}
{“date”:”2018-11-30T00:00:01.567Z”,”level”:”info”,”location”:”[monitoring][createIndex]”,”message”:”Successfully created today index.”}
{“date”:”2018-12-01T00:00:02.368Z”,”level”:”info”,”location”:”[monitoring][createIndex]”,”message”:”Successfully created today index.”}
{“date”:”2018-12-02T00:00:01.297Z”,”level”:”info”,”location”:”[monitoring][createIndex]”,”message”:”Successfully created today index.”}
{“date”:”2018-12-03T00:00:02.052Z”,”level”:”info”,”location”:”[monitoring][createIndex]”,”message”:”Successfully created today index.”}
{“date”:”2018-12-04T00:00:01.602Z”,”level”:”info”,”location”:”[monitoring][createIndex]”,”message”:”Successfully created today index.”}
{“date”:”2018-12-05T00:00:01.886Z”,”level”:”info”,”location”:”[monitoring][createIndex]”,”message”:”Successfully created today index.”}
{“date”:”2018-12-06T00:00:02.870Z”,”level”:”info”,”location”:”[monitoring][createIndex]”,”message”:”Successfully created today index.”}
5. Setup DiskSpaceWatch Cron:
-
- I was getting annoyed with having to deal with the diskspace issues which leads to loss of logs and therefore setup a little bash script called “/usr/bin/diskspacewatch”The script runs as root cron every 30 mins, to get to the cron type ‘crontab -e’
#!/bin/sh
df -h | grep –vE ‘^Filesystem|tmpfs|cdrom‘ | awk‘{ print $5 ” ” $1 }’ | while read output;
do
echo $output
usep=$(echo $output | awk‘{ print $1}’ | cut -d’%’ -f1 )
partition=$(echo $output | awk‘{ print $2 }’ )
if [ $usep –ge75 ]; then
echo “Running out of space!! on wazuh production server. Add space or wazuh will go into read only mode. \”$partition ($usep%)\” on $(hostname) as on $(date)” |
mail -s “Alert: Almost out of disk space, add diskspace to wazuhprod server. $usep%” nick@nicktailor.com
fi
done
-
- If any of the partitions reach 75 percent it will send out an email alert to nick@nicktailor.com
- This is to help avoid log loss from wazuh going into read only mode because of diskspace.
-
- Upgrading wazuh agents to 3.7
Note: Lastly They say in wazuh documentation that the agent is backwards compatible however this is not true in my opinion. Reason being features stop working and now require you to update all the agents. This is not a simple as simply updating the agent….
-
- If you attempt to update the agent simply by yum or apt. It will result in the agent loosing the manager ip and key created.
- This particular piece of the upgrade is something that you should test in a test environment by cloning your entire system to a dev one and running simulations. I learned this the hard way and how to be inventive to get it working.
-
- There is an agent_upgrade tool they provide which is supposed to download the new agent, install, and recopy the manager ip and key to the agent all in one go
-
- List out the agents that need to be upgraded
- /var/ossec/bin/agent_upgrade -l
Example.
Example.
waz01 ~]# /var/ossec/bin/agent_upgrade -l
ID Name Version
003 centosnewtemp Wazuh v3.6.0
165 test1 Wazuh v3.6.1
192 test2 Wazuh v3.6.1
271 test3 Wazuh v3.3.1
277 test4 Wazuh v3.3.1
280 test5 Wazuh v3.3.1
306 test6 Wazuh v3.3.1
313 test6 Wazuh v3.3.1
-
- Manual update of agent(Successful)
# /var/ossec/bin/agent_upgrade -d -a 003
Manager version: v3.7.0
Agent version: v3.3.1
Agent new version: v3.7.0
WPK file already downloaded: /var/ossec/var/upgrade/wazuh_agent_v3.7.0_windows.wpk – SHA1SUM: 79678fd4ab800879aacd4451a64e799c62688b64
Upgrade PKG: wazuh_agent_v3.7.0_windows.wpk (2108 KB)
MSG SENT: 271 com open wb wazuh_agent_v3.7.0_windows.wpk
RESPONSE: ok
MSG SENT: 271 com lock_restart -1
RESPONSE: ok
Chunk size: 512 bytes
Sending: /var/ossec/var/upgrade/wazuh_agent_v3.7.0_windows.wpk
MSG SENT: 271 com close wazuh_agent_v3.7.0_windows.wpk
RESPONSE: ok
MSG SENT: 271 com sha1 wazuh_agent_v3.7.0_windows.wpk
RESPONSE: ok 79678fd4ab800879aacd4451a64e799c62688b64
WPK file sent
MSG SENT: 271 com upgrade wazuh_agent_v3.7.0_windows.wpk upgrade.bat
RESPONSE: ok 0
Upgrade procedure started
MSG SENT: 271 com upgrade_result
RESPONSE: err Maximum attempts exceeded
MSG SENT: 271 com upgrade_result
RESPONSE: err Cannot read upgrade_result file.
MSG SENT: 271 com upgrade_result
RESPONSE: ok 0
Agent upgraded successfully
-
- Using the list provided by agent_upgrade you can copy the agent id’s to a txt file like
- vi agentupgrade.txt
003
165
192
271
Etc…
-
- You can then use a for loop like so to cycle through the list
-
- for name in `cat agentupgrade.txt`; do /var/ossec/bin/agent_upgrade -a $name; echo $name; done
Notes: Exiting the script once its running as it may cause issues as I didn’t put in any error fail to exit obviously.. The other issue I did notice that windows 2016 and windows 7 machines had issues updating the agent I saw the following errors as indicated below. This would update the agent, and then timeout without reinputting the manager ip and key. I had to manually update the failed machines as Wazuh was unable to provide me with answer as to why it was failing. I was able to replicate the issue on 50 machines. So in short if your going to upgrade and have 1000 machines. I highly recommend doing lots of simulations before you upgrade as this is one the most important parts of the upgrade. If they fail to mention in their documentation.
Errors:
# /var/ossec/bin/agent_upgrade -d -a 298
Manager version: v3.7.0
Agent version: v3.3.1
Agent new version: v3.7.0
WPK file already downloaded: /var/ossec/var/upgrade/wazuh_agent_v3.7.0_windows.wpk – SHA1SUM: 79678fd4ab800879aacd4451a64e799c62688b64
Upgrade PKG: wazuh_agent_v3.7.0_windows.wpk (2108 KB)
MSG SENT: 298 com open wb wazuh_agent_v3.7.0_windows.wpk
RESPONSE: err Maximum attempts exceeded
MSG SENT: 298 com open wb wazuh_agent_v3.7.0_windows.wpk
RESPONSE: err Maximum attempts exceeded
MSG SENT: 298 com open wb wazuh_agent_v3.7.0_windows.wpk
RESPONSE: err Maximum attempts exceeded
MSG SENT: 298 com open wb wazuh_agent_v3.7.0_windows.wpk
RESPONSE: err Maximum attempts exceeded
MSG SENT: 298 com open wb wazuh_agent_v3.7.0_windows.wpk
RESPONSE: err Maximum attempts exceeded
MSG SENT: 298 com open wb wazuh_agent_v3.7.0_windows.wpk
RESPONSE: err Maximum attempts exceeded
MSG SENT: 298 com open wb wazuh_agent_v3.7.0_windows.wpk
RESPONSE: err Maximum attempts exceeded
MSG SENT: 298 com open wb wazuh_agent_v3.7.0_windows.wpk
RESPONSE: err Maximum attempts exceeded
MSG SENT: 298 com open wb wazuh_agent_v3.7.0_windows.wpk
RESPONSE: err Maximum attempts exceeded
MSG SENT: 298 com open wb wazuh_agent_v3.7.0_windows.wpk
RESPONSE: err Maximum attempts exceeded
MSG SENT: 298 com open wb wazuh_agent_v3.7.0_windows.wpk
RESPONSE: err Maximum attempts exceeded
Error 1715: Error sending WPK file: Maximum attempts exceeded
Traceback (most recent call last):
File “/var/ossec/bin/agent_upgrade”, line 165, in <module>
main()
File “/var/ossec/bin/agent_upgrade”, line 119, in main
rl_timeout=-1 if args.timeout == None else args.timeout, use_http=use_http)
File “/var/ossec/bin/../framework/wazuh/agent.py”, line 2206, in upgrade
show_progress=show_progress, chunk_size=chunk_size, rl_timeout=rl_timeout, use_http=use_http)
File “/var/ossec/bin/../framework/wazuh/agent.py”, line 2102, in _send_wpk_file
raise WazuhException(1715, data.replace(“err “,””))
wazuh.exception.WazuhException: Error 1715 – Error sending WPK file: Maximum attempts exceeded
How to survive a log flood – wazuh
This is directly from wazuh documentation, but I thought it would good to have here for people browsing through. I guess the main section to take notice of is how to augment the agent buffer via the ossec.conf on the client side for troubleshooting purposes
Survive a log flood
A centralized logging system needs to be able to process many events per second (eps) from many different log sources at the same time, but sometimes things just get completely out of hand. A variety of problems like infinite loop conditions, poorly written software, and misconfigured applications can cause one or a few individual devices to suddenly start producing a huge and unstopping stream of log messages rushing at your logging system at a rate of hundreds or even thousands of events per second. When such a device or devices suddenly take up vastly more than their fair share of network and log processing resources, it can become widely disruptive. Log flooding can saturate your network bandwidth and/or overtax your Wazuh and Elastic system components while one gigabyte after another of likely the same repeated log messages are being reanalyzed and churned to disk.
Thankfully the Wazuh agent has a flood protection mechanism to prevent out of control log production on one system from creating disruptions to your network or to your Wazuh/Elastic services. In this lab we will create a small log flood and observe how it is gracefully contained by the Wazuh agent before it departs the system where the logs are produced. We will also take a look at the leaky bucket queue that Wazuh uses to accomplish this. Lastly we will note the alerts that are produced to keep us informed about the onset of, escalation of, and recovery from log flooding events.
Configure the Wazuh agent client buffer on linux-agent
- In this lab, we will limit agent log production to 20 events per second (eps). By default, this limit is prevented from being set to lower than 50, so we will override that by changing the relevant internal options setting. This does not actually set an eps limit. Rather, it is a strictly agent-side setting that protects the agent from being inadvertently subjected to overly restrictive eps limits pushed to it via Wazuh manager centralized configuration. Here we make it possible to enforce an eps as low as 10.
- #echo“agent.min_eps=10″ >> /var/ossec/etc/local_internal_options.conf
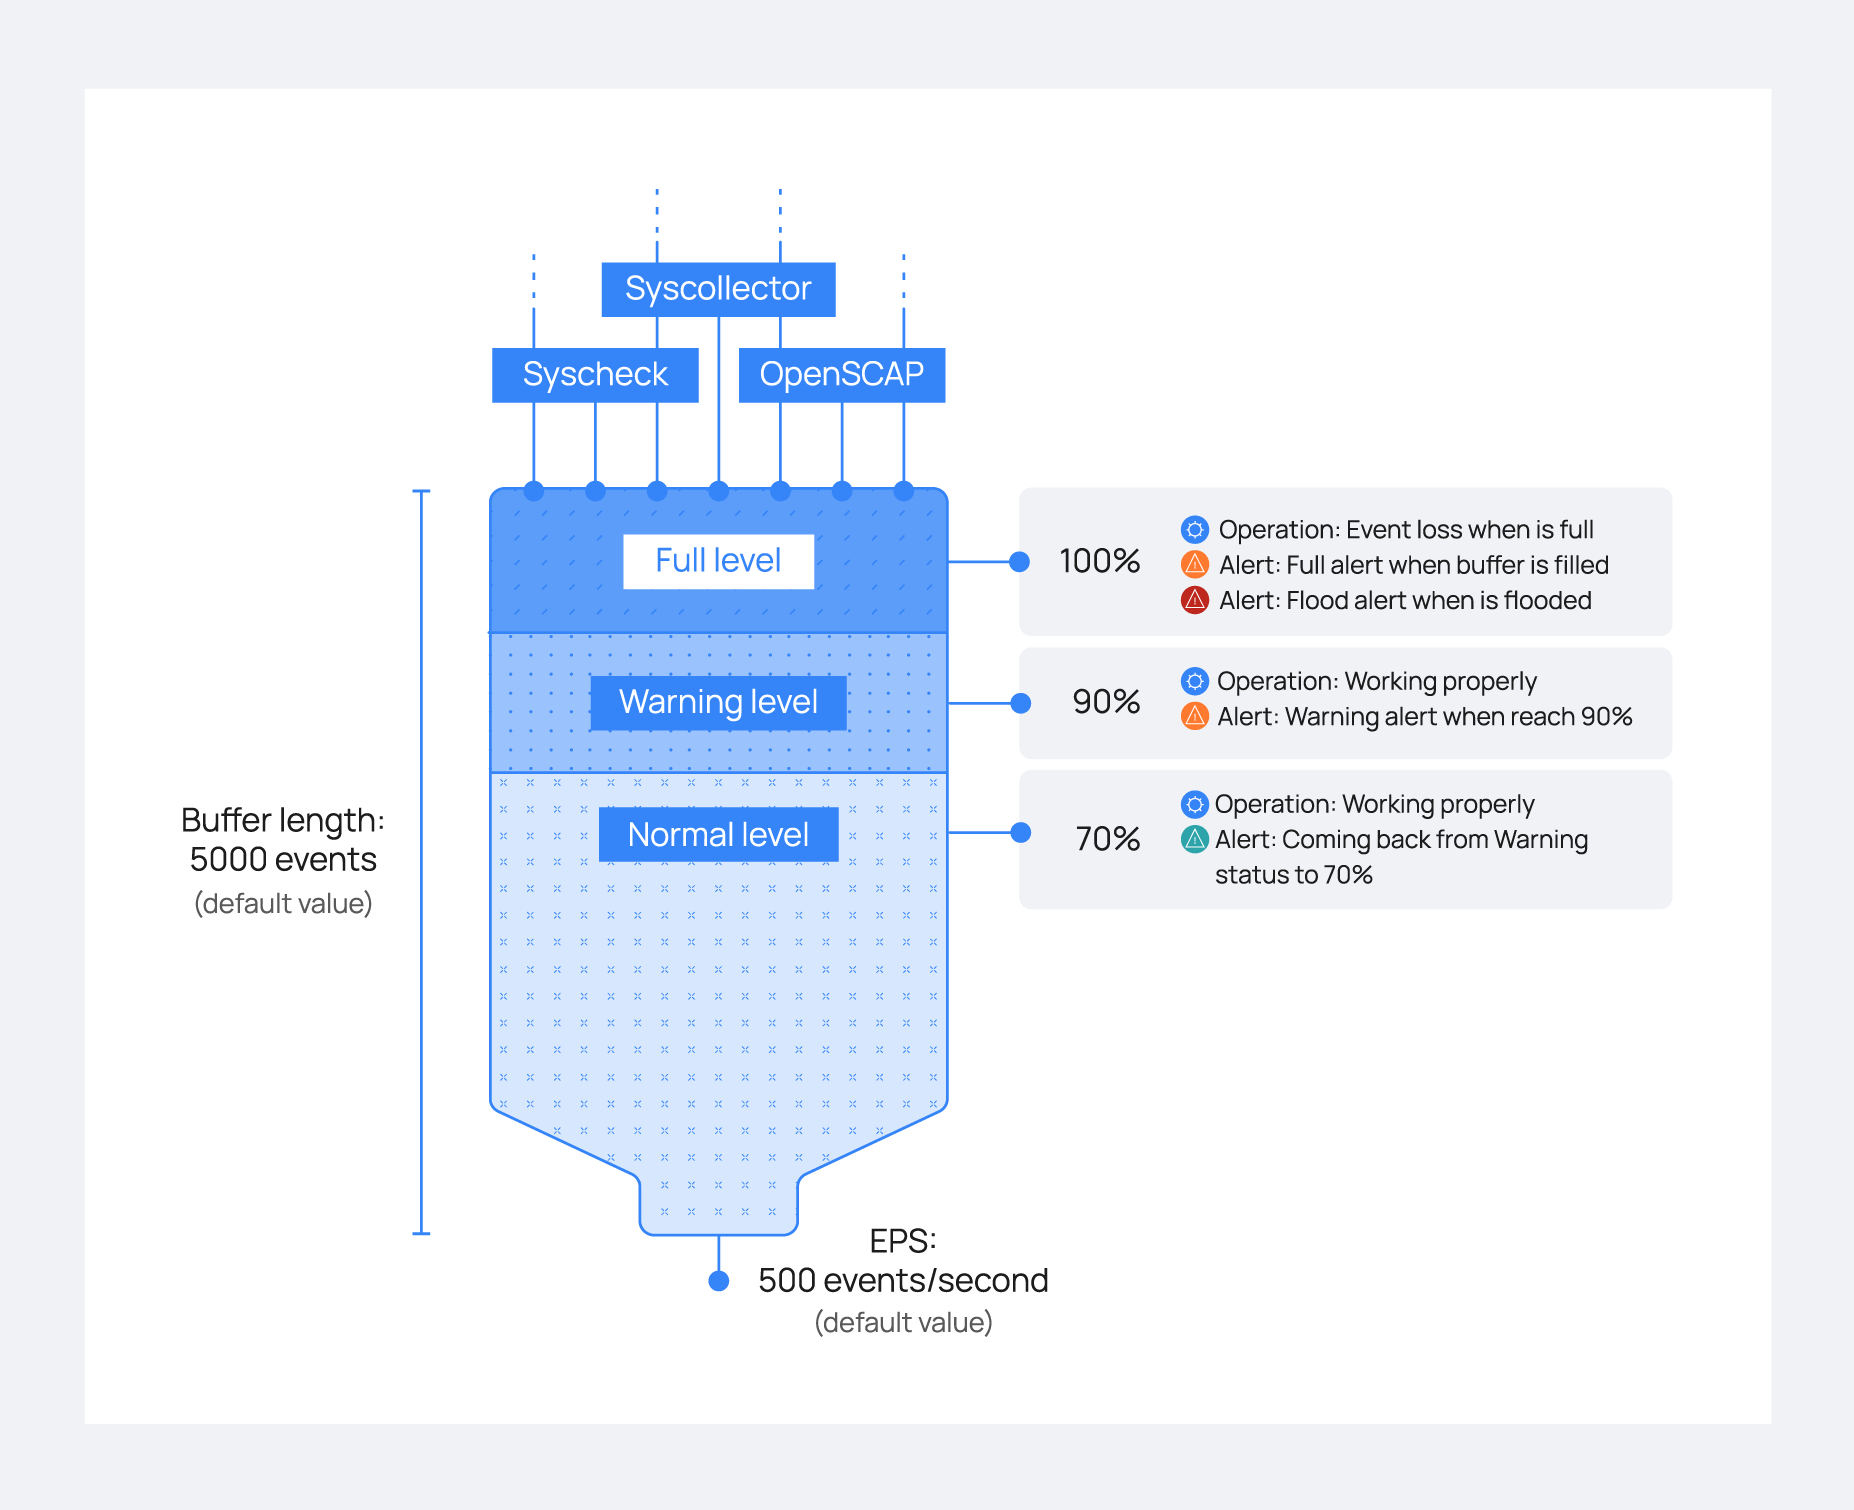
- Open /var/ossec/etc/ossec.conf and find the <client_buffer> section, which looks like this:
- <client_buffer>
- <!– Agent buffer options –>
- <disabled>no</disabled>
- <queue_size>5000</queue_size>
- <events_per_second>500</events_per_second>
- </client_buffer>
- Restart the Wazuh agent
- #ossec-control restart
Note
The client buffer is explained in detail in the Wazuh User manual. Search for “Anti-flooding mechanism”. In brief, it allows a Wazuh agent to limit the rate at which it sends log events to the Wazuh Manager. If events are produced at a rate in excess of the configured eps limit, then they are stored in a leaky bucket queue until the eps rate slows down enough that the queue contents can be sent along to the Wazuh Manager. If the queue gets full, then any new events are droped, i.e the bucket leaks. Various alerts are sent to the Wazuh Manager about all of this.
- To ensure our flood simulation causes queueing and ultimately overflows the queue, change <queue_size> to 500 and <events_per_second> to 20. Save and close ossec.conf. The new section should look like this:
- <client_buffer>
- <!– Agent buffer options –>
- <disabled>no</disabled>
- <queue_size>500</queue_size>
- <events_per_second>20</events_per_second>
- </client_buffer>
Warning
These settings are small for simulation purposes. You would not want to make them this low in production.
Make Wazuh manager record alerts for each flooded event record
Because we will intentionally include the word “fatal” in the flooding log records we generate, they each will trigger generic Wazuh rule 1002 which has a low severity level of 2. By default, Wazuh Manager does not record alerts on rules of severity levels less than 3, so for this lab we will lower the threshold.
- Edit /var/ossec/etc/ossec.conf and change <log_alert_level> from 3 to 1 so that the <alerts> section looks like below. Now alerts of all severity levels will show up in Kibana.
- <alerts>
- <log_alert_level>1</log_alert_level>
- <email_alert_level>12</email_alert_level>
- </alerts>
- Restart Wazuh Manager.
- #ossec-control restart
Generate a log flood on linux-agent
- Create a script called /usr/local/bin/makeflood, with this content:
- #!/bin/bash
- for i in {1..10000}
- do
- echo -n “1:floodtest:Feb 3 03:08:47 linux-agent centos: fatal firehose $i” | ncat –Uu /var/ossec/queue/ossec/queue
- echo -n “.”
- done
Note
While we could write records to a log file monitored by Wazuh agent, this script takes an even faster approach of writing records directly to the Wazuh agent’s internal socket where, for example, ossec-logcollector streams new log lines from log files. The script uses netcat to do this, but any tool that can write datagrams to a Unix socket will do the job. Sometimes it is desirable to have a script on a Wazuh agent send results directly back to the Wazuh manager while completely bypassing the agent’s filesystem. The quoted log line that is piped to netcat consists of three colon-separated parts. First, the “1” corresponds to the syslog log type. The second field causes the location metadata value to be set to “floodtest”. After that is a log line just like you might see in /var/log/messages.
- Make the script executable and then run it to generate a rapid flood of 10,000 log entries.
- #chmod700 /usr/local/bin/makeflood
- #makeflood
- Notice that the periods representing log messages are scrolling acrosss the screen at a rate well above our 20 eps limit.
See what happened according to Kibana
- Query Kibana for “firehose”. Click [Add] next to “full_log” for readability. Change the scale from “Auto” to “Second”.
|
Wazuh Agent Client Buffer |
|
|
- Notice that the flooding events only arrived at the Wazuh Manager at a rate of 20 eps, our intended limit. The client buffer eps limit worked!
- Notice that only 1,269 hits are reported for a flood. It appears many of the flooded events were lost.
- Expand one of the “firehose” records and compare the field values to the script you used to produce these records.
|
|

- Query Kibana for “agent_flooding”. Click [Add] additionally next to “rule.description” and “data.level” for readability.
|
|

- Observe how Wazuh alerts us at various stages of a flooding event so that we can know when we need to intervene with an over-logging system that is not recovering to a normal state on its own.
Return linux-agent to normal client buffer settings
- In the <client_buffer> section of /var/ossec/etc/ossec.conf file, change it back to this:
- <client_buffer>
- <!– Agent buffer options –>
- <disabled>no</disabled>
- <queue_size>5000</queue_size>
- <events_per_second>500</events_per_second>
- </client_buffer>
- Restart the Wazuh agent
- #ossec-control restart
Congratulations on completing this lab. You survived the log flood!
|
|

How to update java on centos
First of all, check your current Java version with this command:
java -version
Example:
$ java -version
java version "1.8.0_181"
Java(TM) SE Runtime Environment (build 1.8.0_181-b13)
Java HotSpot(TM) 64-Bit Server VM (build 25.181-b13, mixed mode)
If your installed version is not Java 8 update 181, then you could follow the step in order to download the latest Java version and install it:
- Download the Java JRE package for RPM-based distributions:
curl -Lo jre-8-linux-x64.rpm --header "Cookie: oraclelicense=accept-securebackup-cookie" "https://download.oracle.com/ otn-pub/java/jdk/8u181-b13/ 96a7b8442fe848ef90c96a2fad6ed6 d1/jre-8u181-linux-x64.rpm" - Check that the package was successfully downloaded:
rpm -qlp jre-8-linux-x64.rpm > /dev/null 2>&1 && echo "Java package downloaded successfully" || echo "Java package did not download successfully" - Install the package using
yum:yum -y install jre-8-linux-x64.rpm rm -f jre-8-linux-x64.rpm
How to diagnose a kernel panic caused by a killed process
You should install atop on your server as this is top on steroids and can help diagnose all kinds of server issues such as.
https://lwn.net/Articles/387202/ – Atop usage
- CPU load
- IO load
- Memory usage
- Process utilization of resources
- Paging/swaping
- etc…
- How you install atop on ubuntu/debian
- ‘apt-get install atop’
- Then you want to start the atop logging
- ‘/etc/init.d/atop start
- ‘/etc/init.d/atop start
Note : by default the atop logs every 10mins
Now lets say you console your VM or blade server. You see a message that states the server killed a process or ran out of memory or something.
Example:
- Out of memory: Kill process 11970 (php) score 80 or sacrifice child
Killed process 11970 (php) total-vm:1957108kB
When you reboot the server you will want to find out exactly how it happened. How you do this is by checking the kernel log. Now if you have kdump installed you can use that to get a dump of the kernel log and if not you can do this.
- dmesg | egrep -i ‘killed process’
- this will provide a log as indicated below
Kernel log
- [Wed July 10 13:27:30 2018] Out of memory: Kill process 11970 (php) score 80 or sacrifice child]
- [Wed July 10 13:27:30 2018] Killed process 11970 (php) total-vm:123412108kB, anon-rss:1213410764kB, file-rss:2420k]
Now once you have this log you can see the time stamp of when it occurred and you can use atop logs to drill down and find the process id, and see if you can see which daemon and or script caused the issue.
From the log ‘July 10 13:27:30 2018’ we can see the time stamp. Inside /var/log/atop you can do the following.
Run the following:
- ‘atop -r atop_20180710’
this will bring up a screen and you can toggle through the time intervals by using lowercase ‘T’ to move forward in time or Capital ‘T’ to go backward in time. - Once you find the time stamp you can
press – ‘c’ – full command-line per process to see which processes were running at that time stamp and you should be able to locate the id process from the kernel log
atop -r atop_20180710’
Example
- 3082 27% php
- 15338 27% php
- 26639 25% php
- 8520 8% php
- 8796 8% php
- 2157 8% /usr/sbin/apache2 -k start
- 11970 1% php – This is the process ID from the kernel log above and what appears to what was running. So we know it was a php script. Atop doesn’t always provide the exact script. However from the kernel log and this we can determine what was some type of rss feed. From this you can also see that it wasnt using very much CPU. This helps us determine that the php code is causing a memory leak and needs to be updated and or disabled.
- 10493 1% php
- 10942 1% php
- 5335 1% php
- 9964 0% php
Written by Nick Tailor
How to setup ansible on centos 7
Prerequisites
To follow this tutorial, you will need:
Step 1 — Installing Ansible
To begin exploring Ansible as a means of managing our various servers, we need to install the Ansible software on at least one machine.
To get Ansible for CentOS 7, first ensure that the CentOS 7 EPEL repository is installed:
Once the repository is installed, install Ansible with yum:
We now have all of the software required to administer our servers through Ansible.
Step 2 — Configuring Ansible Hosts
Ansible keeps track of all of the servers that it knows about through a “hosts” file. We need to set up this file first before we can begin to communicate with our other computers.
Open the file with root privileges like this:
You will see a file that has a lot of example configurations commented out. Keep these examples in the file to help you learn Ansible’s configuration if you want to implement more complex scenarios in the future.
The hosts file is fairly flexible and can be configured in a few different ways. The syntax we are going to use though looks something like this:
Example hosts file
[group_name]
alias ansible_ssh_host=your_server_ip
The group_name is an organizational tag that lets you refer to any servers listed under it with one word. The alias is just a name to refer to that server.
Imagine you have three servers you want to control with Ansible. Ansible communicates with client computers through SSH, so each server you want to manage should be accessible from the Ansible server by typing:
You should not be prompted for a password. While Ansible certainly has the ability to handle password-based SSH authentication, SSH keys help keep things simple.
We will assume that our servers’ IP addresses are 192.168.0.1, 192.168.0.2, and 192.168.0.3. Let’s set this up so that we can refer to these individually as host1, host2, and host3, or as a group as servers. To configure this, you would add this block to your hosts file:
/etc/ansible/hosts
[servers]
host1 ansible_ssh_host=192.168.0.1
host2 ansible_ssh_host=192.168.0.2
host3 ansible_ssh_host=192.168.0.3
Hosts can be in multiple groups and groups can configure parameters for all of their members. Let’s try this out now.
Ansible will, by default, try to connect to remote hosts using your current username. If that user doesn’t exist on the remote system, a connection attempt will result in this error:
Ansible connection error
host1 | UNREACHABLE! => {
“changed”: false,
“msg“: “Failed to connect to the host via ssh.”,
“unreachable”: true
}
Let’s specifically tell Ansible that it should connect to servers in the “servers” group with the nick user. Create a directory in the Ansible configuration structure called group_vars.
Within this folder, we can create YAML-formatted files for each group we want to configure:
Add this code to the file:
/etc/ansible/group_vars/servers
—
ansible_ssh_user: ansiblenick
YAML files start with “—“, so make sure you don’t forget that part.
Save and close this file when you are finished. Now Ansible will always use the ansiblenick user for the servers group, regardless of the current user.
If you want to specify configuration details for every server, regardless of group association, you can put those details in a file at /etc/ansible/group_vars/all. Individual hosts can be configured by creating files under a directory at /etc/ansible/host_vars.
Step 3 — Using Simple Ansible Commands
Now that we have our hosts set up and enough configuration details to allow us to successfully connect to our hosts, we can try out our very first command.
Ping all of the servers you configured by typing:
Ansible will return output like this:
Output
host1 | SUCCESS => {
“changed”: false,
“ping”: “pong”
}
host3 | SUCCESS => {
“changed”: false,
“ping”: “pong”
}
host2 | SUCCESS => {
“changed”: false,
“ping”: “pong”
}
This is a basic test to make sure that Ansible has a connection to all of its hosts.
The -m ping portion of the command is an instruction to Ansible to use the “ping” module. These are basically commands that you can run on your remote hosts. The ping module operates in many ways like the normal ping utility in Linux, but instead it checks for Ansible connectivity.
The all portion means “all hosts.” You could just as easily specify a group:
You can also specify an individual host:
You can specify multiple hosts by separating them with colons:
The shell module lets us send a terminal command to the remote host and retrieve the results. For instance, to find out the memory usage on our host1 machine, we could use:
As you can see, you pass arguments into a script by using the -a switch. Here’s what the output might look like:
Output
host1 | SUCCESS | rc=0 >>
total used free shared buffers cached
Mem: 3954 227 3726 0 14 93
-/+ buffers/cache: 119 3834
Swap: 0 0 0
How to recover file system corruption on 4T LVM using DDrescue on a VM
How to recover file system corruption on 4T LVM on ubuntu using a VM
In this example we will be fixing a xfs filesystem that failed initial xfs_repair
If this happens don’t panic. We can fix most likely fix it.
Steps to do
Create new physical volume, volume group and logical volume
Now install ddrescue and make image of the corrupted file system on the new logical volume
Make swap size 30gigs – this is needed so when we repair the filesystem it doesn’t time out because it runs out of memory. Which tends to be the problem when trying to repair such large filesystems.
Sample outputs
Create rescue image on new logical volume
◦ ddrescue -d -r3 $oldfilesyetem imagefile.img loglocationpath.logfile
ddrescue -d -r3 /dev/recovery/data /mnt/recovery/recovery.img /mnt/recovery/recoverylog.logfile
Once the file is created we want to repair it using xfs_repair
– agno = 29
– agno = 9
– agno = 10
– agno = 11
– agno = 12
– agno = 13
– agno = 14
– 20:02:48: check for inodes claiming duplicate blocks – 88951488 of 88951488 inodes done
Phase 5 – rebuild AG headers and trees…
– 20:02:57: rebuild AG headers and trees – 41 of 41 allocation groups done
– reset superblock…
Phase 6 – check inode connectivity…
– resetting contents of realtime bitmap and summary inodes
– traversing filesystem …
– traversal finished …
– moving disconnected inodes to lost+found …
Phase 7 – verify and correct link counts…
Done
Written By Nick Tailor
How to automate your RedHat Satellite 5.x Channel Cloning
- In order for the scripts to work without sending your password to “ps” you will need to setup a config for spacecmd
Credential File
Spacecmd can be configured with a credentials file so you are not prompted for a username/password each time. This allows for easier scripting.
- Create a hidden spacecmd directory in your home. Lock down permissions.
mkdir ~/.spacecmd
chmod 700 ~/.spacecmd
- Create a config file in the directory and give proper permissions.
touch ~/.spacecmd/config
chmod 600 ~/.spacecmd/config
- Edit the config file and fill in the header, Spacewalk server fqdn, username, and password.
vim ~/.spacecmd/config

[spacecmd]
server=spacewalk.nicktailor.com
username=usernamehere
password=passwordhere
Clone scripts
http://www.nicktailor.com/files/clonechannel.redhat7.sh
http://www.nicktailor.com/files/clonechannel.redhat6.sh
http://www.nicktailor.com/files/clonechannel.redhat5.sh
REDHAT 7 (EXAMPLE)
#!/bin/bash
spacewalkServer=spacewalk.nicktailor.com
defaultOrgAdmin=USER
read -p “Enter to Continue”
How to add Redhat Server 6.0 to Active Directory
We will be using sssd/kerberos/ldap to join the server to a domain in Active directory for SSO(Single Sign On Authentication)
Note: After you have successfully deployed a server using kickstart or manually registered a redhat server to satellite, next we need to join the server to domain controller aka Active Directory
The output will look like something this:
Load smb config files from /etc/samba/smb.conf
Loaded services file OK.
Server role: ROLE_DOMAIN_MEMBER
Press enter to see a dump of your service definitions
[global]
workgroup = NICKSTG
realm = NICKSTG.NICKTAILOR.COM
security = ADS
kerberos method = secrets and keytab
log file = /var/log/
client signing = Yes
idmap config * : backend = tdb
Note: If the nets join fails. It will be due to most likely three reasons.
I ran into the NTP issue. Here is how you fix it.
If your server is not registered to satellite
You will need to have the following files configured as such
/etc/krb5.conf
[logging]
default = FILE:/var/log/krb5libs.log
kdc = FILE:/var/log/krb5kdc.log
admin_server = FILE:/var/log/kadmind.log
[libdefaults]
default_realm = NICKSTG.NICKTAILOR.COM
dns_lookup_realm = false
dns_lookup_kdc = false
ticket_lifetime = 24h
renew_lifetime = 7d
forwardable = true
[realms]
NICKSTG.NICKTAILOR.COM = {
kdc = DC1.NICKTAILOR.COM
admin_server = DC1.NICKTAILOR.COM
}
[domain_realm]
.nickstg.nicktailor.com = = NICKSTG.NICKTAILOR.COM
nickstg.nicktailor.com = = NICKSTG.NICKTAILOR.COM
/etc/oddjobd.conf.d/oddjobd-mkhomedir.conf
<?xml version=”1.0″?>
<!– This configuration file snippet controls the oddjob daemon. It
provides access to mkhomedir functionality via a service named
“com.redhat.oddjob_mkhomedir”, which exposes a single object
(“/”).
The object allows the root user to call any of the standard D-Bus
introspection interface’s methods (these are implemented by
oddjobd itself), and also defines an interface named
“com.redhat.oddjob_mkhomedir”, which provides two methods. –>
<oddjobconfig>
<service name=”com.redhat.oddjob_mkhomedir”>
<object name=”/”>
<interface name=”org.freedesktop.DBus.Introspectable”>
<allow min_uid=”0″ max_uid=”0″/>
<!– <method name=”Introspect”/> –>
</interface>
<interface name=”com.redhat.oddjob_mkhomedir”>
<method name=”mkmyhomedir”>
<helper exec=”/usr/libexec/oddjob/mkhomedir -u 0077″
arguments=”0″
prepend_user_name=”yes”/>
<!– no acl entries -> not allowed for anyone –>
</method>
<method name=”mkhomedirfor”>
<helper exec=”/usr/libexec/oddjob/mkhomedir -u 0077″
arguments=”1″/>
<allow user=”root”/>
</method>
</interface>
</object>
</service>
</oddjobconfig>
================================================================================
/etc/pam.d/password-auth-ac
#%PAM-1.0
# This file is auto-generated.
# User changes will be destroyed the next time authconfig is run.
auth required pam_env.so
auth sufficient pam_unix.so nullok try_first_pass
auth requisite pam_succeed_if.so uid >= 500 quiet
auth sufficient pam_sss.so use_first_pass
auth required pam_deny.so
account required pam_unix.so
account sufficient pam_localuser.so
account sufficient pam_succeed_if.so uid < 500 quiet
account [default=bad success=ok user_unknown=ignore] pam_sss.so
account required pam_permit.so
password requisite pam_cracklib.so try_first_pass retry=3
password sufficient pam_unix.so md5 shadow nullok try_first_pass use_authtok
password sufficient pam_sss.so use_authtok
password required pam_deny.so
session optional pam_keyinit.so revoke
session required pam_limits.so
session optional pam_oddjob_mkhomedir.so skel=/etc/skel
session [success=1 default=ignore] pam_succeed_if.so service in crond quiet use_uid
session required pam_unix.so
session optional pam_sss.so
/etc/pam.d/su
#%PAM-1.0
auth sufficient pam_rootok.so
auth [success=2 default=ignore] pam_succeed_if.so use_uid user ingroup grp_technology_integration_servertech_all
auth [success=1 default=ignore] pam_succeed_if.so use_uid user ingroup wheel
auth required pam_deny.so
auth include system-auth
account sufficient pam_succeed_if.so uid = 0 use_uid quiet
account include system-auth
password include system-auth
session include system-auth
session optional pam_xauth.so
#This line is the last line
/etc/pam.d/system-auth-ac
#%PAM-1.0
# This file is auto-generated.
# User changes will be destroyed the next time authconfig is run.
auth required pam_env.so
auth sufficient pam_fprintd.so
auth sufficient pam_unix.so nullok try_first_pass
auth requisite pam_succeed_if.so uid >= 500 quiet
auth sufficient pam_sss.so use_first_pass
auth required pam_deny.so
account required pam_unix.so
account sufficient pam_localuser.so
account sufficient pam_succeed_if.so uid < 500 quiet
account [default=bad success=ok user_unknown=ignore] pam_sss.so
account required pam_permit.so
password requisite pam_cracklib.so try_first_pass retry=3
password sufficient pam_unix.so md5 shadow nullok try_first_pass use_authtok
password sufficient pam_sss.so use_authtok
password required pam_deny.so
session optional pam_keyinit.so revoke
session required pam_limits.so
session optional pam_oddjob_mkhomedir.so skel=/etc/skel
session [success=1 default=ignore] pam_succeed_if.so service in crond quiet use_uid
session required pam_unix.so
session optional pam_sss.so
/etc/samba/smb.conf
[global]
workgroup = NICKSTG
client signing = yes
client use spnego = yes
kerberos method = secrets and keytab
realm = NICKSTG.NICKTAILOR.COM
security = ads
log file = /var/log/
/etc/sssd/sssd.conf
[sssd]
config_file_version = 2
reconnection_retries = 3
sbus_timeout = 30
services = nss, pam
domains = default, nickstg.nicktailor.com
[nss]
filter_groups = root
filter_users = root,bin,daemon,adm,lp,sync,shutdown,halt,mail,news,uucp,operator,games,gopher,ftp,nobody,vcsa,pcap,ntp,dbus,avahi,rpc,sshd,xfs,rpcuser,nfsnobody,haldaemon,avahi-autoipd,gdm,nscd,oracle, ,deploy,tomcat,jboss,apache,ejabberd,cds,distcache,squid,mailnull,smmsp,backup,bb,clam,obdba,postgres,named,mysql,quova, reconnection_retries = 3
[pam]
reconnection_retries = 3
[domain/nickstg.nicktailor.com]
id_provider = ad
access_provider = simple
cache_credentials = true
#ldap_search_base = OU=NICKSTG-Users,DC=NICKSTG,DC=nicktailor,DC=com
override_homedir = /home/%u
default_shell = /bin/bash
simple_allow_groups = ServerTech_All,Server_Systems_Integration
/etc/sudoers
## /etc/sudoers
## nicktailor sudoers configuration
## Include all configuration from /etc/sudoers.d
## Note: the single # is needed in the line below and is NOT a comment!
#includedir /etc/sudoers.d
##%NICKSTG\\domain\ users ALL = NOPASSWD: ALL
% ServerTech_All ALL = NOPASSWD: ALL
% Server_Systems_Integration ALL = NOPASSWD: ALL
How to do a full restore if you wiped all your LVM’s
I’m sure some of you have had the wonderful opportunity to experience loosing all your LVM info in error. Well all is not lost and there is hope. I will show ya how to restore it.
The beauty of LVM is that is naturally creates a backup of the Logical Volumes in the following location.
- /etc/lvm/archive/
Now If you had just wiped out your LVM and it was simply using one physical disk for all your LVM’s you could simply do a full restore doing the following.
-
-
- vgcfgrestore -f /etc/lvm/archive/(volumegroup to restore) (destination volumegroup)
o (ie.)vgcfgrestore -f /etc/lvm/archive/vg_dev1_006.000001.vg vg_dev
- vgcfgrestore -f /etc/lvm/archive/(volumegroup to restore) (destination volumegroup)
-
If you had multiple disks attached to your volume group then you need to do a couple more things to be able to do a restore.
- Cat the file /etc/lvm/archive/whatevervolumgroup.vg file you should see something like below
- physical_volumes {
pv0 {
id = “ecFWSM-OH8b-uuBB-NVcN-h97f-su1y-nX7jA9”
device = “/dev/sdj” # Hint only
status = [“ALLOCATABLE”]
flags = []
dev_size = 524288000 # 250 Gigabytes
pe_start = 2048
pe_count = 63999 # 249.996 Gigabytes
}
You will need to recreate all the physical volume UUID inside that .vg file for volume group to be able to restore.
-
- pvcreate –restore /etc/lvm/archive/vgfilename.vg –uuid <UUID> <DEVICE>
o (IE) pvcreate –restorefile /etc/lvm/archive/vg_data_00122-1284284804.vg –uuid ecFWSM-OH8b-uuBB-NVcN-h97f-su1y-nX7jA9 /dev/sdj
- pvcreate –restore /etc/lvm/archive/vgfilename.vg –uuid <UUID> <DEVICE>
- Repeat this step for all the physical volumes in the archive vg file until they have all been created.
Once you have completed the above step you should now be able to restore your voluegroups that were wiped
-
- vgcfgrestore -f /etc/lvm/archive/(volumegroup to restore) (destination volumegroup)
o (ie.)vgcfgrestore -f /etc/lvm/archive/vg_dev1_006.000001.vg vg_dev
- vgcfgrestore -f /etc/lvm/archive/(volumegroup to restore) (destination volumegroup)
- Running the command vgdisplay and pvdisplay should show you that everything is back the way it should be
If you have questions email nick@nicktailor.com
Cheers