Author: admin
How to fix in the infiniband issue when migrating multiple bonded nics to redhat 7
Okay so some of you be using malenox FPGA cards which basically bypasses the BUS to give lower latency on your network response time.
Now if you have used an OS like SUSE and had a butt load of bonded nics and then want to migrate the OS and all the bonded nics configurations in an automated fashion using ansible or something configuration management tool.
What some of you might run into is when the OS comes up for the first time, some of the Mellanox nics will boot up in infiniband mode. Which will result in the bonded nics showing up as down. I will show you how to determine this and fix this.
So the first thing you want to do is determine which bonds are showing down
How to check which bonds are down.
Example
root@ansibleclient:~> grep -c down /proc/net/bonding/*
/proc/net/bonding/bond1:0
/proc/net/bonding/bond2:0
/proc/net/bonding/bond3:1 (this indicates that one interface is down)
Example
Bonding Mode: fault-tolerance (active-backup)
Primary Slave: None
Currently Active Slave: eth4
MII Status: up
MII Polling Interval (ms): 100
Up Delay (ms): 0
Down Delay (ms): 0
Slave Interface: eth4
MII Status: up
Speed: 10000 Mbps
Duplex: full
Link Failure Count: 0
Permanent HW addr: 00:02:c9:e9:e9:11
Slave queue ID: 0
Slave Interface: eth5
MII Status: up
Speed: 10000 Mbps
Duplex: full
Link Failure Count: 0
Permanent HW addr: 00:02:c9:e9:e9:12
Slave queue ID: 0
Ethernet Channel Bonding Driver: v3.7.1 (April 27, 2011)
Example – should look something like this. If you don’t see the down nic here for our example lets say its eth5. This could mean its in infiniband mode and not ethernet mode. It also shows if the interface is up or down. Which is very important when troubleshooting the interface
[root@nickansible]# ip a
1: lo: <LOOPBACK,UP,LOWER_UP> mtu 65536 qdisc noqueue state UNKNOWN group default qlen 1000
link/loopback 00:00:00:00:00:00 brd 00:00:00:00:00:00
inet 127.0.0.1/8 scope host lo
valid_lft forever preferred_lft forever
2: enp0s3: <BROADCAST,MULTICAST,UP,LOWER_UP> mtu 1500 qdisc pfifo_fast state UP group default qlen 1000
link/ether 08:00:26:9a:33:59 brd ff:ff:ff:ff:ff:ff
inet 10.0.2.15/24 brd 10.0.2.255 scope global noprefixroute dynamic enp0s3
valid_lft 82770sec preferred_lft 82770sec
3: enp0s8: <BROADCAST,MULTICAST,UP,LOWER_UP> mtu 1500 qdisc pfifo_fast state UP group default qlen 1000
link/ether 08:00:26:88:5a:fd brd ff:ff:ff:ff:ff:ff
inet 192.168.1.11/24 brd 192.168.1.255 scope global noprefixroute dynamic enp0s8
valid_lft 82773sec preferred_lft 82773sec
Example.
It will look something like this.
[root@nick ansible# ethtool -i eth5
driver: e1000
version: 7.3.21-k8-NAPI
firmware-version:
expansion-rom-version:
bus-info: 0000:00:18.0 (this is the important info you need)
supports-statistics: yes
supports-test: yes
supports-eeprom-access: yes
supports-register-dump: yes
supports-priv-flags: no
Example
[root@nick ansible]# lspci -s 0000:00:18.0.0
00:18:00 Ethernet controller: Mellanox Technologies MT26448 [ConnectX EN 10GigE, PCIe 2.0 5GT/s]
Okay so now when you do ‘ip a’ you should should see the nics up and if you check the status of the bond there should be 0 bonds down. You might have to bring the bond down and up.
Now the issue here is that if you aren’t able to get rpms from Mellanox that are supported by patching in your organisation. You’re going to need a way to ensure that if the server reboots the nic will start up in ethernet mode, otherwise you could be in a very bad situation if the server boots and the nic came up in infiniband mode.
So there are a couple of ideas I came up with to solve this.
Option:
1.This the approach I chose and the cooler way to go about it. In redhat 7 you can define a if-preup-local script which will run anytime “ifup” is run.
Here is how you set that up.
ADD this inside and save the file
#!/bin/bash
#
LID=”00:00:00:00″
for i in `ls /etc/sysconfig/network-scripts/ifcfg-* 2> /dev/null`
do
for j in `grep HWADDR $i |awk -F\” ‘{print $2}’`
do
ID1=$(echo $j | awk -F\: ‘{print $2″:”$3}’)
ID2=$(echo $j | awk -F\: ‘{print $4″:”$5}’)
ID=”$ID1:$ID2″
PORT=$(echo $j | cut -c 16-17)
for k in `ls /sys/bus/pci/devices/0000\:*\:00.0/net/ib[0-9]/address 2> /dev/null`
do
grep “$ID1.*$ID2” $k 1> /dev/null
if [ $? -eq 0 ]; then
if [ “x$ID” != “x$LID” ]; then
mlxport=1
else
let “mlxport++”
fi
LID=$ID
p=$(echo $k | awk -F/ ‘{print “/sys/bus/pci/devices/”$6″/”}’)
echo “Running: echo eth > ${p}mlx4_port${mlxport}”
echo eth > ${p}mlx4_port${mlxport}
fi
done
done
done
Now when you run ifup it will run that script that check to see if the any of those bus and macs are in infinband mode and bring them into eth. It safer to do this way because if you restart the network and for some reason the nic goes back into infiniband and someone new had no idea. They would spend awhile trying to figure this out.
How do deploy this fix via anisble role coming soon……
How to build a server using kickstart satellite 6.x
Note: This document is assuming that your capsule server are already configured and your dhcpd service is running and your subnets have been added to the config already.
Manual process:
HOST TAB
Under Create hosts there are a bunch of tabs that need to be filled out.
Name * (This is the name of your vm) – “nick.test1.com”
This value is used also as the host’s primary interface name.
Organisation * Which ever ORG which want the host to live in (LCH)
Location * london
Host Group – We will do this late for now just choose an existing non-prod group.
Deploy on – Bare Metal
Lifecycle Environment Non-Prod
Content View – Select a content view that exists, check under content view
Content Source – leave blank
Interfaces TAB
Type : Interface
MAC address : Grab the mac address from vcenter or login in existing OS and get interface mac-address
Device identifier : en016780032
DNS name “nick.test1.com
Domain : nicktailor.com
IPv4 Subnet: subnet the vlan lives on(this is setup on capsule server)
nick-10.61.120.0-26(10.61.120.0/26)
IPv6 Subnet
IPv4 address : 10.61.120.45
Managed (checked)
Primary (checked)
Provision(checked)
Remote execution(checked)
Operating System TAB
Architecture * :x86_64
Operating system *: RHEL Server 7.4
Media SelectionSynced Content All Media
Select the installation media that will be used to provision this host. Choose ‘Synced Content’ for Synced Kickstart Repositories or ‘All Media’ for other media.
Media *: RHE7-cap01 (this is where the repositories live)
Partition table *: RHEL7-TESTING (make sure this attached to a hostgroup and operating sytem) Under HOSTS & CONFIGURE)
PXE loader : PXELinux BIOS (this is for the PXE Boot)
Custom partition table (leave blank unless you want to overide
What ever text(or ERB template) you use in here, would be used as your OS disk layout options If you want to use the partition table option, delete all of the text from this field
Root password : password
Password must be 8 characters or more
Pamameters TAB
Puppet class parameters
Puppet class Name Value Omit
Global parameters:
Capsule : nick-cap01.com
Activation_keys: RHEL7-2017-12-PROD
nick-cap01.com
kt_activation_keys: RHEL7-2017-12-Prod
(if you override the default key it shows up below)
puppet_server : nick-pup02.com
Host parameters:
Name Value Actions
kt_activation_keys
RHEL7-2017-12-Non-Prod (nonprod)
Additional Information TAB
Owned by: Nick Tailor
Enabled: Include this host within satellite reporting (check this)
Hardware Model
Commen: Blank
Next Step – Create a hostgroup
Under Configure select Host Groups( You need a host group in for your deployment to work properly without this is will not work )
Note: Generally its easier to clone an existing hostgroup, change the name and edit the settings to save you time. However for the purposes of this document. We are going to go through the process.
Host Group Tab
Parent
Name *: Nick-hax0r-servers (Project name – servers)
Lifecycle Environment: NON-PROD (make sure you have lifecycle environment configured)
Content View : RHEL7-2019-03 (Make sure to select a content view that exists, you can go to content views and look at which it exists and the copy and paste the name exactly)
Content Source: nick-cap01.com(This is the capsule server where the content for the repositories exist for the dev environment, in addition where the subnets are defined that these project servers can dhcp from pxeboot)
Puppet Environment: Non_Production_RHEL7_2019_03_127
Note: (Define this is you have a puppet environment configured with satellite. You will need to have your puppet environment match this content view if you do)
Compute profile : Blank
Puppet Master: Blank
Puppet CA: Blank
OpenSCAP Capsule : Blank
Note: (This is good for pulling server information and vulnerabilities)
Network TAB
Domain: nicktailor.com
IPv4 Subnet: NTC-10.61.120.0-26(10.61.120.0/26)
Note: (These subnets are defined in satellite under Infrastructure and then Subnets)
IPv6 : No Subnet
Realm: Blank
Operating System TAB
Architecture: x86_64
Operating system * : RHEL Server 7.4
(Note: This section is very important. You will need to attach the partition table to the operating system under Hosts and Operating System. If you do not when you make your provision template this host group will not be able to see the partition table you created when you choose the OS you want to deploy.
Media Selection Synced Content All Media
Select the installation media that will be used to provision this host. Choose ‘Synced Content’ for Synced Kickstart Repositories or ‘All Media’ for other media.
Media *: RHEL7-nick-cap01
Partition table *: RHEL7-Testing
(Note: This is created under HOSTS and Partition Table)
PXE loader: Blank
Root password: Password (set this for your server to desired setting)
Parameters TAB
Global Parameters
Host group parameters:
Name: Value:
Capsule nick-cap01.com
puppet_server nick-pup02.com
Note:(You only need this define i`f you have a puppet server environment configured)
Locations TAB
Under Selected Items:
Add London
Organizations TAB
Under Selected Items:
Add organizations you want to have access to the host group
ADD: LCH
Activation Keys TAB
Activation keys: RHEL7-2017-12-Non-Prod (this key defines which organization, host group, repositories, life cycle environment and organization the host initially gets registered with. You can manually change these setting after, however its probably good to make a proper key to save you lots of time.
Next Step – Created Patition Table
HOSTS and Partition Tables
(Note: Its generally better to clone an exitsing table and edit as needed, however for the purposes of this doc, we will go through the settings) You will also need to add this table to your operating system under Hosts and Operating system for the provision template to work properly)
Template TAB
Name * : GTP-RHEL7-Testing (Name your partition table scheme)
Default
Default templates are automatically added to new organisations and locations
Snippet
Operating system family: RED HAT
Input:
Note: This is a standard lvm setup using ext4 for the OS. If you are going to use dual boot, then you want to change the first 3 lines
zerombr
clearpart –drives=sda –all –initlabel
part /boot –fstype ext4 –size=1024 –asprimary –ondisk=sda
part pv.00 –size=1 –grow –asprimary –ondisk=sda
volgroup vgroot pv.00
logvol / –name=lv_root –vgname=vgroot –size=15360 –fstype ext4
logvol swap –name=lv_swap –vgname=vgroot –size 6144 –fstype swap
logvol /var –name=lv_var –vgname=vgroot –size 10240 –fstype ext4
logvol /opt –name=lv_opt –vgname=vgroot –size 10240 –fstype ext4
logvol /var/tmp –name=lv_var_tmp –vgname=vgroot –size 5120 –fstype ext4 –fsoptions=nodev,nosuid,noexec
logvol /var/log –name=lv_var_log –vgname=vgroot –size 5120 –fstype ext4
logvol /var/log/audit –name=lv_var_log_audit –vgname=vgroot –size 2048 –fstype ext4
logvol /var/coredumps –name=lv_crash –vgname=vgroot –size 16384 –fstype ext4
logvol /tmp –name=lv_tmp –vgname=vgroot –size 5120 –fstype ext4 –fsoptions=nodev,nosuid,noexec
logvol /home –name=lv_home –vgname=vgroot –size 5120 –fstype ext4 –fsoptions=nodev
Dual Boot template:
Note: Change the drive designation from sda to sdx (x being whatever the new drive designation is) In the example below its /dev/sdc
clearpart –drives=sdc –all –initlabel
part /boot –fstype ext4 –size=1024 –asprimary –ondisk=sdc
part pv.00 –size=1 –grow –asprimary –ondisk=sdc
volgroup vgroot pv.00
logvol / –name=lv_root –vgname=vgroot –size=15360 –fstype ext4
logvol swap –name=lv_swap –vgname=vgroot –size 6144 –fstype swap
logvol /var –name=lv_var –vgname=vgroot –size 10240 –fstype ext4
logvol /opt –name=lv_opt –vgname=vgroot –size 10240 –fstype ext4
logvol /var/tmp –name=lv_var_tmp –vgname=vgroot –size 5120 –fstype ext4 –fsoptions=nodev,nosuid,noexec
logvol /var/log –name=lv_var_log –vgname=vgroot –size 5120 –fstype ext4
logvol /var/log/audit –name=lv_var_log_audit –vgname=vgroot –size 2048 –fstype ext4
logvol /var/coredumps –name=lv_crash –vgname=vgroot –size 16384 –fstype ext4
logvol /tmp –name=lv_tmp –vgname=vgroot –size 5120 –fstype ext4 –fsoptions=nodev,nosuid,noexec
logvol /home –name=lv_home –vgname=vgroot –size 5120 –fstype ext4 –fsoptions=nodev
Locations TAB
Under Selected Items:
ADD: London
Organization TAB
Under Selected Items:
ADD: NTC
Next Step – ADD New Partition Table to Operating System
Note- (This part is important. The way to figure out which OS to choose is to check the which repositories are available on the capsule server defined. Say you chose RHEL7. 4, but the repository doesn’t exist there. The provision template will then choose the default template and your partition template and everything will no longer be there and you could accident deploy on the wrong disk wiping out data potentially)
Example if we chose the content view RHEL7-2019-03 and the OS RHEL7.4 in the provision template but on the capsule server. The path shows only 7.5 under that content view, the url would fail during the deployment and revert 7.2 default settings and would use a different partition table if the one you created wasn’t available under the default OS setting.
root@nick-cap01:/var/lib/pulp/published/yum/http/repos/NTC/Non-Production/RHEL7-2019-03/content/dist/rhel/server/7/7.5
I found its best to use the default OS and then just ensure that yum update is in the kickstart file that is going to be used
Will look like this in the kickstart file.
# update all the base packages from the updates repository
yum -t -y -e 0 update
Now go back to your New your provision template.
Under Hosts and Provision Template.
Now to set your server to build status so that the PXEboot is able to pick it up on network book.
Now we can test the deployment from VCENTER
SMTP auth relay with postfix
In case that your SMTP server has authentication (like Gmail), For this purpose we will use Postfix. I
Install the needed packages:
Ubuntu
apt-get install postfix mailutils libsasl2-2 ca-certificates libsasl2-modules
CentOS
yum update && yum install postfix mailx cyrus-sasl cyrus-sasl-plain
- Set Postfix config file /etc/postfix/main.cf. Add this lines to the end of the file:
-
Set Postfix config file
/etc/postfix/main.cf. Add this lines to the end of the file:Ubuntu
relayhost = [smtp.gmail.com]:587
smtp_sasl_auth_enable = yes
smtp_sasl_password_maps = hash:/etc/postfix/sasl_passwd
smtp_sasl_security_options = noanonymous
smtp_tls_CAfile = /etc/ssl/certs/thawte_Primary_Root_CA.pem
smtp_use_tls = yes
CentOS
relayhost = [smtp.gmail.com]:587
smtp_sasl_auth_enable = yes
smtp_sasl_password_maps = hash:/etc/postfix/sasl_passwd
smtp_sasl_security_options = noanonymous
smtp_tls_CAfile = /etc/ssl/certs/ca-bundle.crt
smtp_use_tls = yes
-
Configure email address and password:
echo [smtp.gmail.com]:587 USERNAME@gmail.com:PASSWORD > /etc/postfix/sasl_passwd
postmap /etc/postfix/sasl_passwd
chmod 400 /etc/postfix/sasl_passwd
-
Secure DB password
chown root:root /etc/postfix/sasl_passwd /etc/postfix/sasl_passwd.db
chmod 0600 /etc/postfix/sasl_passwd /etc/postfix/sasl_passwd.db
-
Reload Postfix
systemctl reload postfix
-
Test you configuration with:
echo "Test mail from postfix" | mail -s "Test Postfix" you@example.com
echo "Test mail from postfix" | mail -s "Test Postfix" -r someone@whatever.com you@example.com (this is if your reply address has to come from a specific sender)
You should receive an email on
you@example.com
You should receive an email on you@example.com
Note: If you are using centos 7, which uses systemD. You will find that postfix doesn’t send maillogs to /var/log/maillog. Someone decided it would be a great idea to send it to the journaler instead.
In order to find your mail logs and or tail the logs for postfix.
- Journalctl -u postfix (view all logs)
- Journalctl -u postfix -f (to tail the mail logs)
How to properly upgrade wazuh with a major update (standalone setup)
Upgrade from the same major version (3.x)
The following steps show how to upgrade to the latest available version of Wazuh 3.x (which implies upgrading to the latest version of Elastic Stack 6.x).
Starting the upgrade
If you followed our manager or agents installation guides, probably you disabled the repository in order to avoid undesired upgrades. It’s necessary to enable them again to get the last packages.
- For CentOS/RHEL/Fedora:
#sed –i“s/^enabled=0/enabled=1/” /etc/yum.repos.d/wazuh.repo
Upgrade the Wazuh manager
Note
Since Wazuh v3.7.0 the File Integrity Monitoring database is not used anymore. In order to add to Wazuh DB the file and registry entries stored from previous versions it’s necessary to run the FIM migration tool.
- Upgrade the wazuh-manager package:
- For CentOS/RHEL/Fedora:
# yum upgrade wazuh-manager
- Upgrade the wazuh-api package:
- For CentOS/RHEL/Fedora:
# yum upgrade wazuh-api
Note
The installation of the updated packages will automatically restart the services for the Wazuh manager, API and agents. Your Wazuh config file will keep unmodified, so you’ll need to manually add the settings for the new capabilities. Check the User Manual for more information.
Finishing the Wazuh upgrade
You’ve finished upgrading your Wazuh installation to the latest version. Now you can disable again the Wazuh repositories in order to avoid undesired upgrades and compatibility issues.
- For CentOS/RHEL/Fedora:
#sed –i“s/^enabled=1/enabled=0/” /etc/yum.repos.d/wazuh.repo
Upgrade to the latest Elastic Stack version
Since the release of Wazuh 3.0.0, there’s been several updates to the 6.x version of the Elastic Stack, introducing several bugfixes and important changes. In order to use the latest version of Wazuh, it’s necessary to install the latest compatible Elastic Stack packages.
- Stop the services:
#systemctl stop filebeat (This you do not need to stop in a standalone setup, because it should not be installed. Filebeat is only used when you have a clustered setup. It sends logs back to the manager when clustered)
#systemctl stop logstash
#systemctl stop kibana
#systemctl stop elasticsearch
- Enable the Elastic repository:
If you followed our Elastic Stack Installation Guide, probably you disabled the repository in order to avoid undesired upgrades for the Elastic Stack. It’s necessary to enable them again to get the last packages.
- For CentOS/RHEL/Fedora:
#sed –i“s/^enabled=0/enabled=1/” /etc/yum.repos.d/elastic.repo
Upgrade Elasticsearch
- Upgrade the elasticsearch package:
- For CentOS/RHEL/Fedora:
# yum install elasticsearch-6.5.1
- Start the Elasticsearch service:
#systemctl daemon-reload
#systemctlenableelasticsearch.service
#systemctl start elasticsearch.service
It’s important to wait until the Elasticsearch server finishes starting. Check the current status with the following command, which should give you a response like the shown below:
# curl "http://localhost:9200/?pretty"

{
  "name" : "Zr2Shu_",
  "cluster_name" : "elasticsearch",
  "cluster_uuid" : "M-W_RznZRA-CXykh_oJsCQ",
  "version" : {
    "number" : "6.5.1",
    "build_flavor" : "default",
    "build_type" : "rpm",
    "build_hash" : "053779d",
    "build_date" : "2018-07-20T05:20:23.451332Z",
    "build_snapshot" : false,
    "lucene_version" : "7.3.1",
    "minimum_wire_compatibility_version" : "5.6.0",
    "minimum_index_compatibility_version" : "5.0.0"
  },
  "tagline" : "You Know, for Search"
}
Updating the Elasticsearch template to the latest version is mandatory in order to avoid compatibility issues with the latest versions of Wazuh and the Elastic Stack.
# curl https://raw.githubusercontent.com/wazuh/wazuh/3.7/extensions/elasticsearch/wazuh-elastic6-template-alerts.json | curl -X PUT "http://localhost:9200/_template/wazuh" -H 'Content-Type: application/json' -d @-
Upgrade Logstash
- Upgrade the logstash package:
- For CentOS/RHEL/Fedora:
# yum install logstash-6.5.1
- Download and set the Wazuh configuration for Logstash:
- Local configuration:
# cp /etc/logstash/conf.d/01-wazuh.conf /backup_directory/01-wazuh.conf.bak
# curl -so /etc/logstash/conf.d/01-wazuh.conf https://raw.githubusercontent.com/wazuh/wazuh/3.7/extensions/logstash/01-wazuh-local.conf
# usermod -a -G ossec logstash
- Remote configuration: (We are not using this in our standalone setup and therefore do not need to run this)
# cp /etc/logstash/conf.d/01-wazuh.conf /backup_directory/01-wazuh.conf.bak
# curl -so /etc/logstash/conf.d/01-wazuh.conf https://raw.githubusercontent.com/wazuh/wazuh/3.7/extensions/logstash/01-wazuh-remote.conf
- Start the Logstash service:
#systemctl daemon-reload
#systemctlenablelogstash.service
#systemctl start logstash.service
Note
The Logstash configuration file has been replaced for an updated one. If you already configured the encryption between Filebeat and Logstash, don’t forget to check again Setting up SSL for Filebeat and Logstash if you’re using a distributed architecture.
Upgrade Kibana
- Upgrade the kibana package:
- For CentOS/RHEL/Fedora:
# yum install kibana-6.5.1
- Uninstall the Wazuh app from Kibana:
- Update file permissions. This will avoid several errors prior to updating the app:
#chown -R kibana:kibana /usr/share/kibana/optimize
#chown -R kibana:kibana /usr/share/kibana/plugins
- Remove the Wazuh app:
#sudo -u kibana /usr/share/kibana/bin/kibana-plugin remove wazuh
- Upgrade the Wazuh app:
# rm -rf /usr/share/kibana/optimize/bundles
#sudo -u kibanaNODE_OPTIONS=“–max-old-space-size=3072” /usr/share/kibana/bin/kibana-plugin install https://packages.wazuh.com/wazuhapp/wazuhapp-3.7.1_6.5.1.zip
Warning
The Wazuh app installation process may take several minutes. Please wait patiently.
- Start the Kibana service:
#systemctl daemon-reload
#systemctlenablekibana.service
#systemctl start kibana.service
This section only applies if you have clustered/distributed setup
Upgrade Filebeat
- Upgrade the filebeat package:
- For CentOS/RHEL/Fedora:
# yum install filebeat-6.5.1
- Start the Filebeat service:
#systemctl daemon-reload
#systemctlenablefilebeat.service
#systemctl start filebeat.service
Finishing the Elastic Stack upgrade
You’ve finished upgrading your Wazuh installation to the latest version. Now you can disable again the Elastic Stack repositories in order to avoid undesired upgrades and compatibility issues with the Wazuh app.
- For CentOS/RHEL/Fedora:
#sed –i“s/^enabled=1/enabled=0/” /etc/yum.repos.d/elastic.repo
Things you will need to fix after the upgrade
1. Running migration tool for versions before 3.7 for that have upgraded recently:
-
If you upgraded from wazuh 3.6 or newer you will need to run the following migration tool, which migrate the database into a new format for wazuh 3.7When they first introduced the tool it had some fail to exit code if it couldn’t decode a line and it would halt the migration. They have since fixed that, however it look something like this.2018-11-12 15:45:38 [INFO] [32/239] Added 3339 file entries in agent ‘033’ database.
2018-11-12 15:45:38 [INFO] Setting FIM database for agent ‘033’ as completed…
2018-11-12 15:45:38 [INFO] [33/239] Upgrading FIM database for agent ‘034’…
2018-11-12 15:45:38 [INFO] [33/239] Added 61 file entries in agent ‘034’ database.
2018-11-12 15:45:38 [INFO] [33/239] Upgrading FIM database (syscheck-registry) for agent ‘034’…
2018-11-12 15:45:38 [ERROR] Couldn’t decode line at syscheck database.
Traceback (most recent call last):
File “./fim_migrate“, line 320, in <module>
if not check_file_entry(agt[0], decoded[2], s):
File “./fim_migrate“, line 91, in check_file_entry
msg = msg + cfile + b”‘;”
TypeError: cannot concatenate ‘str’ and ‘NoneType‘ objects
working migration tool below
https://raw.githubusercontent.com/wazuh/wazuh/3.7/tools/migration/fim_migrate.py
2. error “api version type mismatch 3.6.1′‘ :
-
After the upgrade when you go into the kibana interface and it does a systems check you might see this error.
Resolution :
- First make sure all the app versions match.
https://documentation.wazuh.com/current/installation-guide/compatibility_matrix/index.html#api-and-kibana-app
- Next run this on the server side to confirm they match
- cat /usr/share/kibana/plugins/wazuh/package.json | grep –i -E “version|revision“
“version”: “3.7.0”,
“revision”: “0413”,
“version”: “6.4.3”
If all those match then you simply need to do the following to fix it.
- Delete the .wazuh-version index:
curl -XDELETE http://elastic_ip:9200/.wazuh-version
- Restart Kibana:
systemctl restart kibana
Wait for about 30 s – 1 min and now open a new window in your browser, then you should navigate without any more troubles regarding the version mismatching.
Notes: The Wazuh app creates that index when you restart Kibana if it’s not present. If your standalone setup is using localhost then the curl command should be localhost and not the elastic ip.
3. Items listed per screen when listing agents will default back to 17 items for screen and is extremely annoying. You will need to fix this in the following manner.:
# systemctl stop kibana
Let’s open the file under /usr/share/kibana/plugins/wazuh/public/templates/agents-prev/agents-prev.html and look for lines 103-109:
<wz-table flex path=“‘/agents'” keys=“[‘id’,{value:’name’,size:2},’ip’,’status’,’group’,’os.name‘,’os.version’,’version’]” allow-click=“true” row-sizes=“[17,15,13]”></wz-table>
The wz-table tag is related to a Wazuh custom directive which has parameters to easy change that limit.
Replace [17,15,13] by your desired size [50,50,50], where each value refers to different screen sizes. Use 50 for all screen sizes,
and you’ll see 50 agents per page regardless your screen size. Use your desired value, it can be 100 or 150…
My suggestion is to don’t increase more than 50 (Angular performance reasons).
Once you are done save and close the file. Now remove old bundles and check the permissions again:
rm –rf /usr/share/kibana/optimize/bundleschown –R kibana:kibana /usr/share/kibana/optimizechown –R kibana:kibana /usr/share/kibana/plugins
Restart Kibana:
# systemctl restart kibana
It takes a few of minutes until it’s completed, you can check the status using the next command:
# systemctl status kibana -l
You’ll see “Optimizing…”, once you see “App ready to be used” you can remove cache/cookies from your browser and type your App address for accessing it.
4. Errors in wazuh log after upgrade [FORBIDDEN/12/index read-only / allow delete (api)];”}:
- If you see the following your wazuh.log
- tail -n500 /usr/share/kibana/optimize/wazuh-logs/wazuhapp.log
{“date”:”2018-11-22T14:24:15.613Z”,”level”:”info”,”location”:”[monitoring][init]”,”message”:”Checking if wazuh-monitoring pattern exists…”}
{“date”:”2018-11-22T14:24:15.625Z”,”level”:”error”,”location”:”[initialize][checkKnownFields]”,”message”:”[cluster_block_exception] blocked by: [FORBIDDEN/12/index read-only / allow delete (api)];”}
{“date”:”2018-11-22T14:24:15.632Z”,”level”:”info”,”location”:”[monitoring][init]”,”message”:”Updating known fields for wazuh-monitoring pattern…”}
{“date”:”2018-11-22T14:24:15.646Z”,”level”:”info”,”location”:”[monitoring][init]”,”message”:”Didn’t find wazuh-monitoring pattern for Kibana v6.x. Proceeding to create it…”}
{“date”:”2018-11-22T14:24:15.650Z”,”level”:”info”,”location”:”[monitoring][createWazuhMonitoring]”,”message”:”No need to delete old wazuh-monitoring pattern.”}
{“date”:”2018-11-22T14:24:15.650Z”,”level”:”info”,”location”:”[monitoring][configureKibana]”,”message”:”Creating index pattern: wazuh-monitoring-3.x-*”}
{“date”:”2018-11-22T14:24:15.658Z”,”level”:”info”,”location”:”[initialize][checkAPIEntriesExtensions]”,”message”:”Successfully updated API entry extensions with ID: 1535484412304″}
{“date”:”2018-11-22T14:24:15.660Z”,”level”:”error”,”location”:”[monitoring][configureKibana]”,”message”:”[cluster_block_exception] blocked by: [FORBIDDEN/12/index read-only / allow delete (api)];”
-
- This usually means that one of your partitions is near full and wazuh goes into read only mode because of this, super annoying…..
To fix this you must :
-
- first add diskspace to your lvm, if you don’t know how to do this look it up…haha 😛
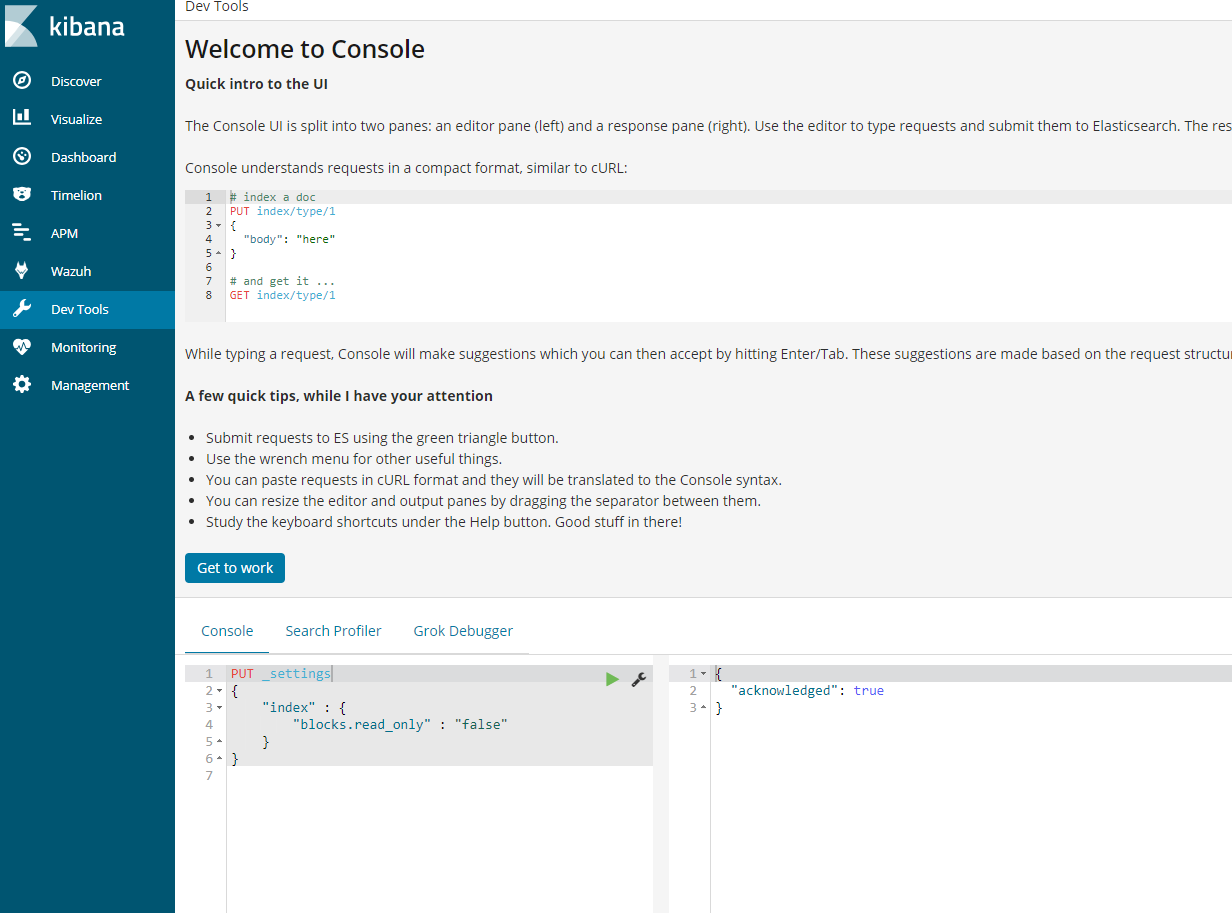
- The you must go into the kibana interface and under under dev tools run the following
- PUT wazuh–monitoring-*/_settings{ “index”: { “blocks”: { “read_only_allow_delete“: “false” } }}
-
- Make sure to restart kibana:
- systemctl restart kibana
Once kibana is restarted the log should look show something like this.
- tail -n500 /usr/share/kibana/optimize/wazuh-logs/wazuhapp.log
{“date”:”2018-11-23T00:00:02.464Z”,”level”:”info”,”location”:”[monitoring][createIndex]”,”message”:”Successfully created today index.”}
Note: Initially you might only see on entry for that day, however after a few days the logs will look like this.
{“date”:”2018-11-22T14:25:09.166Z”,”level”:”error”,”location”:”[monitoring][configureKibana]”,”message”:”[cluster_block_exception] blocked by: [FORBIDDEN/12/index read-only / allow delete (api)];”}
{“date”:”2018-11-23T00:00:02.464Z”,”level”:”info”,”location”:”[monitoring][createIndex]”,”message”:”Successfully created today index.”}
{“date”:”2018-11-24T00:00:01.894Z”,”level”:”info”,”location”:”[monitoring][createIndex]”,”message”:”Successfully created today index.”}
{“date”:”2018-11-25T00:00:02.055Z”,”level”:”info”,”location”:”[monitoring][createIndex]”,”message”:”Successfully created today index.”}
{“date”:”2018-11-26T00:00:01.983Z”,”level”:”info”,”location”:”[monitoring][createIndex]”,”message”:”Successfully created today index.”}
{“date”:”2018-11-27T00:00:02.785Z”,”level”:”info”,”location”:”[monitoring][createIndex]”,”message”:”Successfully created today index.”}
{“date”:”2018-11-28T00:00:02.458Z”,”level”:”info”,”location”:”[monitoring][createIndex]”,”message”:”Successfully created today index.”}
{“date”:”2018-11-29T00:00:02.163Z”,”level”:”info”,”location”:”[monitoring][createIndex]”,”message”:”Successfully created today index.”}
{“date”:”2018-11-29T14:41:46.871Z”,”level”:”info”,”location”:”[initialize]”,”message”:”Kibana index: .kibana“}
{“date”:”2018-11-29T14:41:46.874Z”,”level”:”info”,”location”:”[initialize]”,”message”:”App revision: 0413″}
{“date”:”2018-11-29T14:41:46.874Z”,”level”:”info”,”location”:”[monitoring][configuration]”,”message”:”wazuh.monitoring.enabled: true”}
{“date”:”2018-11-29T14:41:46.874Z”,”level”:”info”,”location”:”[monitoring][configuration]”,”message”:”wazuh.monitoring.frequency: 3600 (0 */60 * * * *) “}
{“date”:”2018-11-29T14:41:46.874Z”,”level”:”info”,”location”:”[monitoring][checkKibanaStatus]”,”message”:”Waiting for Kibana and Elasticsearch servers to be ready…”}
{“date”:”2018-11-29T14:41:48.241Z”,”level”:”info”,”location”:”[initialize][checkWazuhIndex]”,”message”:”Checking .wazuh index.”}
{“date”:”2018-11-29T14:41:48.241Z”,”level”:”info”,”location”:”[initialize][checkWazuhVersionIndex]”,”message”:”Checking .wazuh-version index.”}
{“date”:”2018-11-29T14:41:48.246Z”,”level”:”info”,”location”:”[monitoring][init]”,”message”:”Creating/Updating wazuh-agent template…”}
{“date”:”2018-11-29T14:41:48.246Z”,”level”:”info”,”location”:”[monitoring][checkTemplate]”,”message”:”Updating wazuh-monitoring template…”}
{“date”:”2018-11-29T14:41:48.945Z”,”level”:”info”,”location”:”[initialize][checkKnownFields]”,”message”:”x-pack enabled: no”}
{“date”:”2018-11-29T14:41:48.999Z”,”level”:”info”,”location”:”[initialize][checkKnownFields]”,”message”:”Found 2 index patterns”}
{“date”:”2018-11-29T14:41:48.999Z”,”level”:”info”,”location”:”[initialize][checkKnownFields]”,”message”:”Found 1 valid index patterns for Wazuh alerts”}
{“date”:”2018-11-29T14:41:48.999Z”,”level”:”info”,”location”:”[initialize][checkKnownFields]”,”message”:”Default index pattern found”}
{“date”:”2018-11-29T14:41:48.999Z”,”level”:”info”,”location”:”[initialize][checkKnownFields]”,”message”:”Refreshing known fields for \”index-pattern:wazuh-alerts-3.x-*\””}
{“date”:”2018-11-29T14:41:49.092Z”,”level”:”info”,”location”:”[initialize][checkKnownFields]”,”message”:”App ready to be used.”}
{“date”:”2018-11-29T14:41:49.181Z”,”level”:”info”,”location”:”[initialize][checkAPIEntriesExtensions]”,”message”:”Checking extensions consistency for all API entries”}
{“date”:”2018-11-29T14:41:49.188Z”,”level”:”info”,”location”:”[initialize][checkAPIEntriesExtensions]”,”message”:”Successfully updated API entry extensions with ID: 1535484412304″}
{“date”:”2018-11-29T14:41:49.266Z”,”level”:”info”,”location”:”[monitoring][init]”,”message”:”Creating today index…”}
{“date”:”2018-11-29T14:41:49.295Z”,”level”:”info”,”location”:”[monitoring][init]”,”message”:”Checking if wazuh-monitoring pattern exists…”}
{“date”:”2018-11-29T14:41:49.314Z”,”level”:”info”,”location”:”[monitoring][init]”,”message”:”Updating known fields for wazuh-monitoring pattern…”}
{“date”:”2018-11-29T14:41:49.320Z”,”level”:”info”,”location”:”[monitoring][init]”,”message”:”Skipping wazuh-monitoring pattern creation. Already exists.”}
{“date”:”2018-11-30T00:00:01.567Z”,”level”:”info”,”location”:”[monitoring][createIndex]”,”message”:”Successfully created today index.”}
{“date”:”2018-12-01T00:00:02.368Z”,”level”:”info”,”location”:”[monitoring][createIndex]”,”message”:”Successfully created today index.”}
{“date”:”2018-12-02T00:00:01.297Z”,”level”:”info”,”location”:”[monitoring][createIndex]”,”message”:”Successfully created today index.”}
{“date”:”2018-12-03T00:00:02.052Z”,”level”:”info”,”location”:”[monitoring][createIndex]”,”message”:”Successfully created today index.”}
{“date”:”2018-12-04T00:00:01.602Z”,”level”:”info”,”location”:”[monitoring][createIndex]”,”message”:”Successfully created today index.”}
{“date”:”2018-12-05T00:00:01.886Z”,”level”:”info”,”location”:”[monitoring][createIndex]”,”message”:”Successfully created today index.”}
{“date”:”2018-12-06T00:00:02.870Z”,”level”:”info”,”location”:”[monitoring][createIndex]”,”message”:”Successfully created today index.”}
5. Setup DiskSpaceWatch Cron:
-
- I was getting annoyed with having to deal with the diskspace issues which leads to loss of logs and therefore setup a little bash script called “/usr/bin/diskspacewatch”The script runs as root cron every 30 mins, to get to the cron type ‘crontab -e’
#!/bin/sh
df -h | grep –vE ‘^Filesystem|tmpfs|cdrom‘ | awk‘{ print $5 ” ” $1 }’ | while read output;
do
echo $output
usep=$(echo $output | awk‘{ print $1}’ | cut -d’%’ -f1 )
partition=$(echo $output | awk‘{ print $2 }’ )
if [ $usep –ge75 ]; then
echo “Running out of space!! on wazuh production server. Add space or wazuh will go into read only mode. \”$partition ($usep%)\” on $(hostname) as on $(date)” |
mail -s “Alert: Almost out of disk space, add diskspace to wazuhprod server. $usep%” nick@nicktailor.com
fi
done
-
- If any of the partitions reach 75 percent it will send out an email alert to nick@nicktailor.com
- This is to help avoid log loss from wazuh going into read only mode because of diskspace.
-
- Upgrading wazuh agents to 3.7
Note: Lastly They say in wazuh documentation that the agent is backwards compatible however this is not true in my opinion. Reason being features stop working and now require you to update all the agents. This is not a simple as simply updating the agent….
-
- If you attempt to update the agent simply by yum or apt. It will result in the agent loosing the manager ip and key created.
- This particular piece of the upgrade is something that you should test in a test environment by cloning your entire system to a dev one and running simulations. I learned this the hard way and how to be inventive to get it working.
-
- There is an agent_upgrade tool they provide which is supposed to download the new agent, install, and recopy the manager ip and key to the agent all in one go
-
- List out the agents that need to be upgraded
- /var/ossec/bin/agent_upgrade -l
Example.
Example.
waz01 ~]# /var/ossec/bin/agent_upgrade -l
ID Name Version
003 centosnewtemp Wazuh v3.6.0
165 test1 Wazuh v3.6.1
192 test2 Wazuh v3.6.1
271 test3 Wazuh v3.3.1
277 test4 Wazuh v3.3.1
280 test5 Wazuh v3.3.1
306 test6 Wazuh v3.3.1
313 test6 Wazuh v3.3.1
-
- Manual update of agent(Successful)
# /var/ossec/bin/agent_upgrade -d -a 003
Manager version: v3.7.0
Agent version: v3.3.1
Agent new version: v3.7.0
WPK file already downloaded: /var/ossec/var/upgrade/wazuh_agent_v3.7.0_windows.wpk – SHA1SUM: 79678fd4ab800879aacd4451a64e799c62688b64
Upgrade PKG: wazuh_agent_v3.7.0_windows.wpk (2108 KB)
MSG SENT: 271 com open wb wazuh_agent_v3.7.0_windows.wpk
RESPONSE: ok
MSG SENT: 271 com lock_restart -1
RESPONSE: ok
Chunk size: 512 bytes
Sending: /var/ossec/var/upgrade/wazuh_agent_v3.7.0_windows.wpk
MSG SENT: 271 com close wazuh_agent_v3.7.0_windows.wpk
RESPONSE: ok
MSG SENT: 271 com sha1 wazuh_agent_v3.7.0_windows.wpk
RESPONSE: ok 79678fd4ab800879aacd4451a64e799c62688b64
WPK file sent
MSG SENT: 271 com upgrade wazuh_agent_v3.7.0_windows.wpk upgrade.bat
RESPONSE: ok 0
Upgrade procedure started
MSG SENT: 271 com upgrade_result
RESPONSE: err Maximum attempts exceeded
MSG SENT: 271 com upgrade_result
RESPONSE: err Cannot read upgrade_result file.
MSG SENT: 271 com upgrade_result
RESPONSE: ok 0
Agent upgraded successfully
-
- Using the list provided by agent_upgrade you can copy the agent id’s to a txt file like
- vi agentupgrade.txt
003
165
192
271
Etc…
-
- You can then use a for loop like so to cycle through the list
-
- for name in `cat agentupgrade.txt`; do /var/ossec/bin/agent_upgrade -a $name; echo $name; done
Notes: Exiting the script once its running as it may cause issues as I didn’t put in any error fail to exit obviously.. The other issue I did notice that windows 2016 and windows 7 machines had issues updating the agent I saw the following errors as indicated below. This would update the agent, and then timeout without reinputting the manager ip and key. I had to manually update the failed machines as Wazuh was unable to provide me with answer as to why it was failing. I was able to replicate the issue on 50 machines. So in short if your going to upgrade and have 1000 machines. I highly recommend doing lots of simulations before you upgrade as this is one the most important parts of the upgrade. If they fail to mention in their documentation.
Errors:
# /var/ossec/bin/agent_upgrade -d -a 298
Manager version: v3.7.0
Agent version: v3.3.1
Agent new version: v3.7.0
WPK file already downloaded: /var/ossec/var/upgrade/wazuh_agent_v3.7.0_windows.wpk – SHA1SUM: 79678fd4ab800879aacd4451a64e799c62688b64
Upgrade PKG: wazuh_agent_v3.7.0_windows.wpk (2108 KB)
MSG SENT: 298 com open wb wazuh_agent_v3.7.0_windows.wpk
RESPONSE: err Maximum attempts exceeded
MSG SENT: 298 com open wb wazuh_agent_v3.7.0_windows.wpk
RESPONSE: err Maximum attempts exceeded
MSG SENT: 298 com open wb wazuh_agent_v3.7.0_windows.wpk
RESPONSE: err Maximum attempts exceeded
MSG SENT: 298 com open wb wazuh_agent_v3.7.0_windows.wpk
RESPONSE: err Maximum attempts exceeded
MSG SENT: 298 com open wb wazuh_agent_v3.7.0_windows.wpk
RESPONSE: err Maximum attempts exceeded
MSG SENT: 298 com open wb wazuh_agent_v3.7.0_windows.wpk
RESPONSE: err Maximum attempts exceeded
MSG SENT: 298 com open wb wazuh_agent_v3.7.0_windows.wpk
RESPONSE: err Maximum attempts exceeded
MSG SENT: 298 com open wb wazuh_agent_v3.7.0_windows.wpk
RESPONSE: err Maximum attempts exceeded
MSG SENT: 298 com open wb wazuh_agent_v3.7.0_windows.wpk
RESPONSE: err Maximum attempts exceeded
MSG SENT: 298 com open wb wazuh_agent_v3.7.0_windows.wpk
RESPONSE: err Maximum attempts exceeded
MSG SENT: 298 com open wb wazuh_agent_v3.7.0_windows.wpk
RESPONSE: err Maximum attempts exceeded
Error 1715: Error sending WPK file: Maximum attempts exceeded
Traceback (most recent call last):
File “/var/ossec/bin/agent_upgrade”, line 165, in <module>
main()
File “/var/ossec/bin/agent_upgrade”, line 119, in main
rl_timeout=-1 if args.timeout == None else args.timeout, use_http=use_http)
File “/var/ossec/bin/../framework/wazuh/agent.py”, line 2206, in upgrade
show_progress=show_progress, chunk_size=chunk_size, rl_timeout=rl_timeout, use_http=use_http)
File “/var/ossec/bin/../framework/wazuh/agent.py”, line 2102, in _send_wpk_file
raise WazuhException(1715, data.replace(“err “,””))
wazuh.exception.WazuhException: Error 1715 – Error sending WPK file: Maximum attempts exceeded
How to survive a log flood – wazuh
This is directly from wazuh documentation, but I thought it would good to have here for people browsing through. I guess the main section to take notice of is how to augment the agent buffer via the ossec.conf on the client side for troubleshooting purposes
Survive a log flood
A centralized logging system needs to be able to process many events per second (eps) from many different log sources at the same time, but sometimes things just get completely out of hand. A variety of problems like infinite loop conditions, poorly written software, and misconfigured applications can cause one or a few individual devices to suddenly start producing a huge and unstopping stream of log messages rushing at your logging system at a rate of hundreds or even thousands of events per second. When such a device or devices suddenly take up vastly more than their fair share of network and log processing resources, it can become widely disruptive. Log flooding can saturate your network bandwidth and/or overtax your Wazuh and Elastic system components while one gigabyte after another of likely the same repeated log messages are being reanalyzed and churned to disk.
Thankfully the Wazuh agent has a flood protection mechanism to prevent out of control log production on one system from creating disruptions to your network or to your Wazuh/Elastic services. In this lab we will create a small log flood and observe how it is gracefully contained by the Wazuh agent before it departs the system where the logs are produced. We will also take a look at the leaky bucket queue that Wazuh uses to accomplish this. Lastly we will note the alerts that are produced to keep us informed about the onset of, escalation of, and recovery from log flooding events.
Configure the Wazuh agent client buffer on linux-agent
- In this lab, we will limit agent log production to 20 events per second (eps). By default, this limit is prevented from being set to lower than 50, so we will override that by changing the relevant internal options setting. This does not actually set an eps limit. Rather, it is a strictly agent-side setting that protects the agent from being inadvertently subjected to overly restrictive eps limits pushed to it via Wazuh manager centralized configuration. Here we make it possible to enforce an eps as low as 10.
- #echo“agent.min_eps=10″ >> /var/ossec/etc/local_internal_options.conf
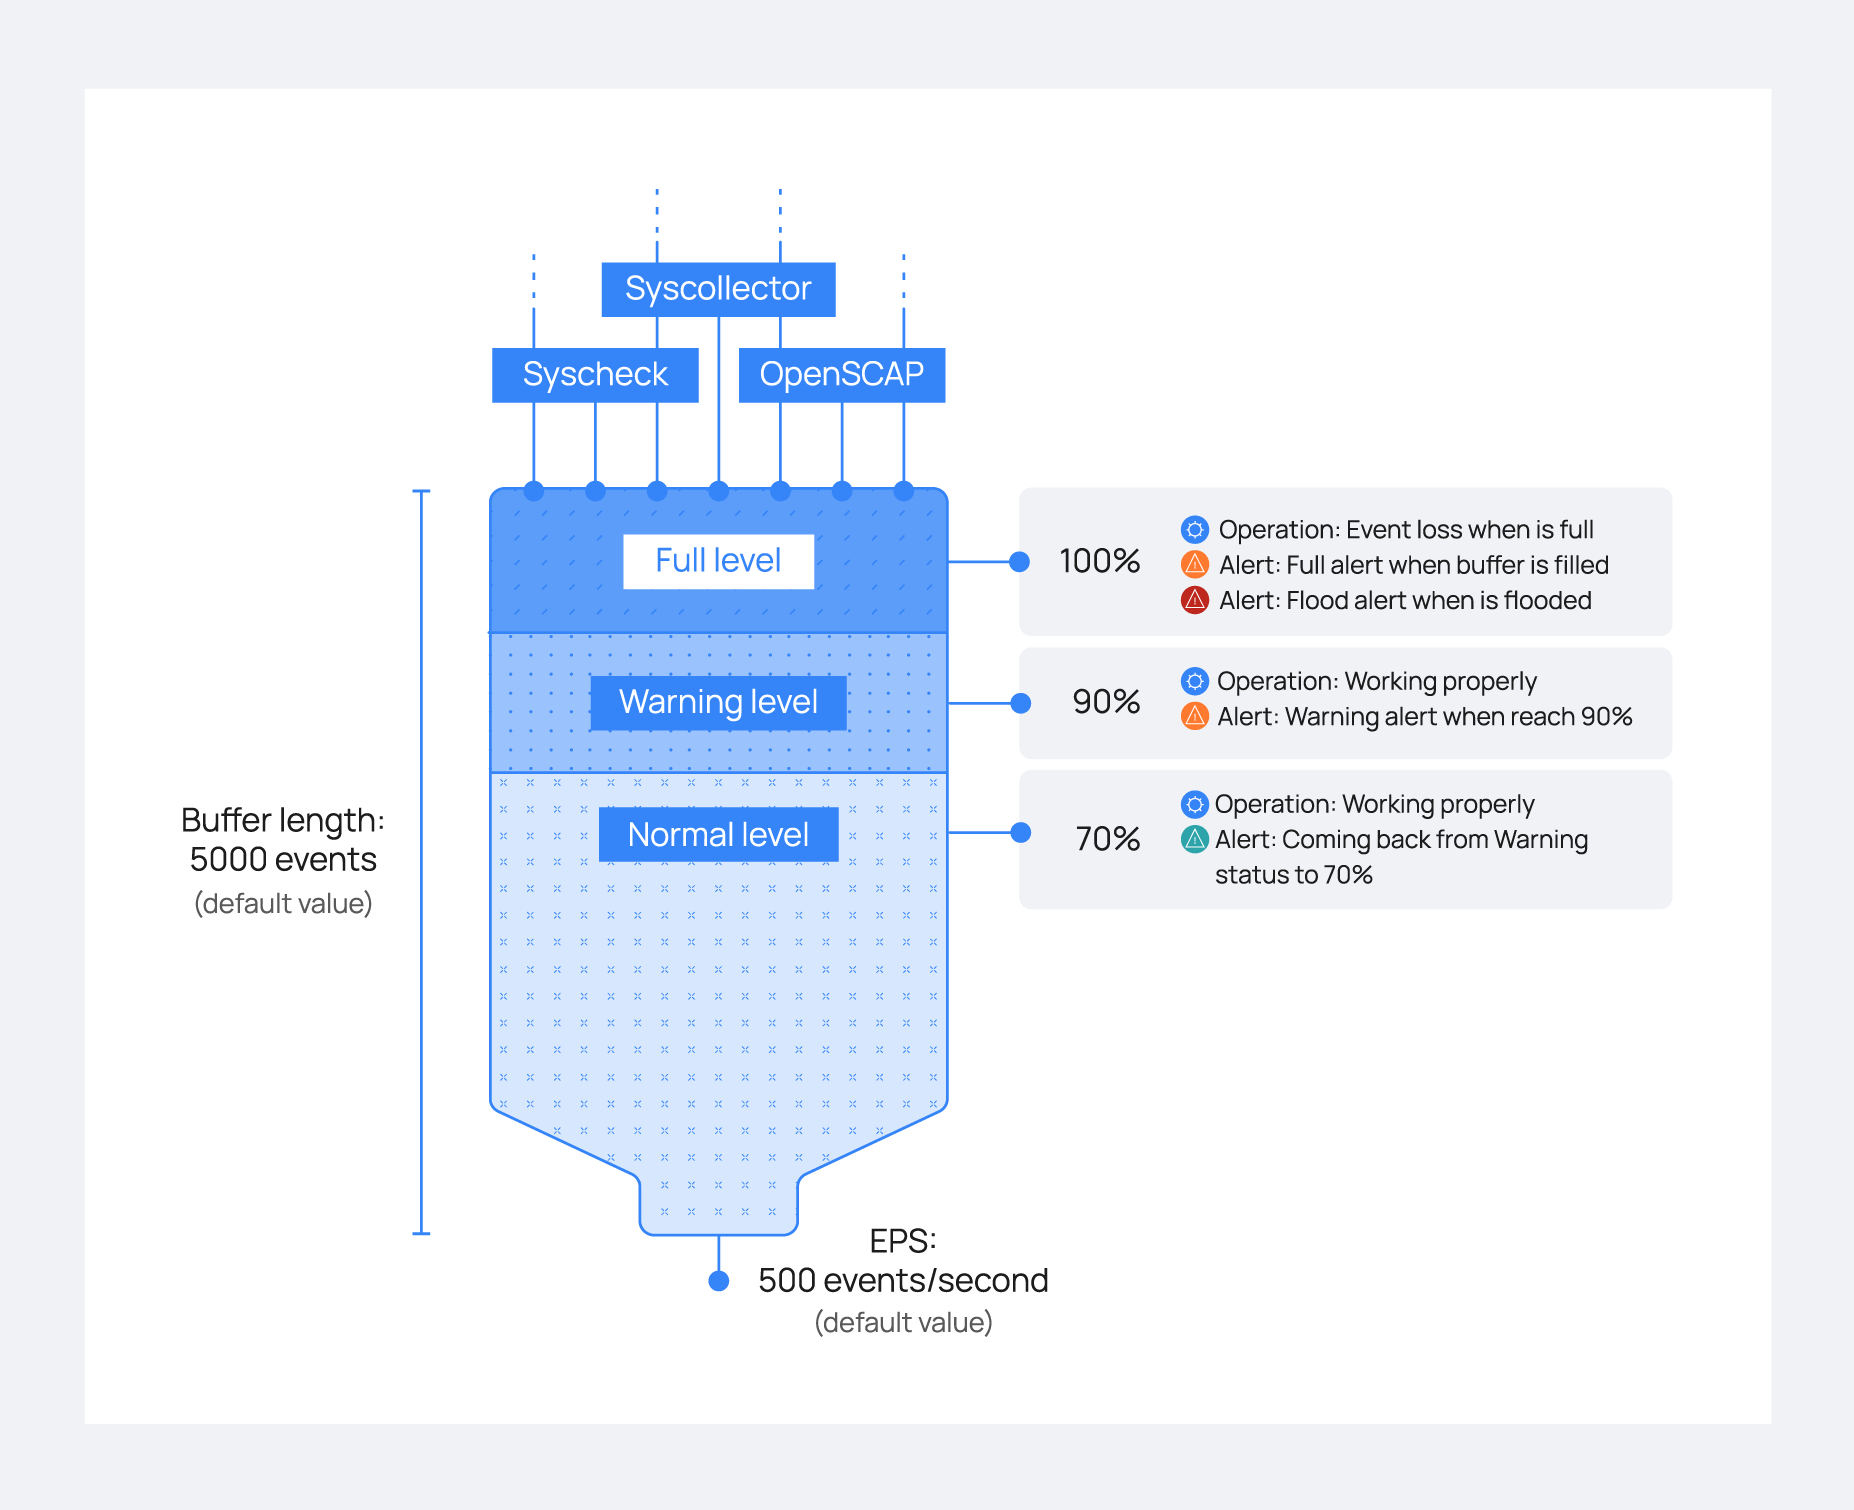
- Open /var/ossec/etc/ossec.conf and find the <client_buffer> section, which looks like this:
- <client_buffer>
- <!– Agent buffer options –>
- <disabled>no</disabled>
- <queue_size>5000</queue_size>
- <events_per_second>500</events_per_second>
- </client_buffer>
- Restart the Wazuh agent
- #ossec-control restart
Note
The client buffer is explained in detail in the Wazuh User manual. Search for “Anti-flooding mechanism”. In brief, it allows a Wazuh agent to limit the rate at which it sends log events to the Wazuh Manager. If events are produced at a rate in excess of the configured eps limit, then they are stored in a leaky bucket queue until the eps rate slows down enough that the queue contents can be sent along to the Wazuh Manager. If the queue gets full, then any new events are droped, i.e the bucket leaks. Various alerts are sent to the Wazuh Manager about all of this.
- To ensure our flood simulation causes queueing and ultimately overflows the queue, change <queue_size> to 500 and <events_per_second> to 20. Save and close ossec.conf. The new section should look like this:
- <client_buffer>
- <!– Agent buffer options –>
- <disabled>no</disabled>
- <queue_size>500</queue_size>
- <events_per_second>20</events_per_second>
- </client_buffer>
Warning
These settings are small for simulation purposes. You would not want to make them this low in production.
Make Wazuh manager record alerts for each flooded event record
Because we will intentionally include the word “fatal” in the flooding log records we generate, they each will trigger generic Wazuh rule 1002 which has a low severity level of 2. By default, Wazuh Manager does not record alerts on rules of severity levels less than 3, so for this lab we will lower the threshold.
- Edit /var/ossec/etc/ossec.conf and change <log_alert_level> from 3 to 1 so that the <alerts> section looks like below. Now alerts of all severity levels will show up in Kibana.
- <alerts>
- <log_alert_level>1</log_alert_level>
- <email_alert_level>12</email_alert_level>
- </alerts>
- Restart Wazuh Manager.
- #ossec-control restart
Generate a log flood on linux-agent
- Create a script called /usr/local/bin/makeflood, with this content:
- #!/bin/bash
- for i in {1..10000}
- do
- echo -n “1:floodtest:Feb 3 03:08:47 linux-agent centos: fatal firehose $i” | ncat –Uu /var/ossec/queue/ossec/queue
- echo -n “.”
- done
Note
While we could write records to a log file monitored by Wazuh agent, this script takes an even faster approach of writing records directly to the Wazuh agent’s internal socket where, for example, ossec-logcollector streams new log lines from log files. The script uses netcat to do this, but any tool that can write datagrams to a Unix socket will do the job. Sometimes it is desirable to have a script on a Wazuh agent send results directly back to the Wazuh manager while completely bypassing the agent’s filesystem. The quoted log line that is piped to netcat consists of three colon-separated parts. First, the “1” corresponds to the syslog log type. The second field causes the location metadata value to be set to “floodtest”. After that is a log line just like you might see in /var/log/messages.
- Make the script executable and then run it to generate a rapid flood of 10,000 log entries.
- #chmod700 /usr/local/bin/makeflood
- #makeflood
- Notice that the periods representing log messages are scrolling acrosss the screen at a rate well above our 20 eps limit.
See what happened according to Kibana
- Query Kibana for “firehose”. Click [Add] next to “full_log” for readability. Change the scale from “Auto” to “Second”.
|
Wazuh Agent Client Buffer |
|
|
- Notice that the flooding events only arrived at the Wazuh Manager at a rate of 20 eps, our intended limit. The client buffer eps limit worked!
- Notice that only 1,269 hits are reported for a flood. It appears many of the flooded events were lost.
- Expand one of the “firehose” records and compare the field values to the script you used to produce these records.
|
|

- Query Kibana for “agent_flooding”. Click [Add] additionally next to “rule.description” and “data.level” for readability.
|
|

- Observe how Wazuh alerts us at various stages of a flooding event so that we can know when we need to intervene with an over-logging system that is not recovering to a normal state on its own.
Return linux-agent to normal client buffer settings
- In the <client_buffer> section of /var/ossec/etc/ossec.conf file, change it back to this:
- <client_buffer>
- <!– Agent buffer options –>
- <disabled>no</disabled>
- <queue_size>5000</queue_size>
- <events_per_second>500</events_per_second>
- </client_buffer>
- Restart the Wazuh agent
- #ossec-control restart
Congratulations on completing this lab. You survived the log flood!
|
|

How to update java on centos
First of all, check your current Java version with this command:
java -version
Example:
$ java -version
java version "1.8.0_181"
Java(TM) SE Runtime Environment (build 1.8.0_181-b13)
Java HotSpot(TM) 64-Bit Server VM (build 25.181-b13, mixed mode)
If your installed version is not Java 8 update 181, then you could follow the step in order to download the latest Java version and install it:
- Download the Java JRE package for RPM-based distributions:
curl -Lo jre-8-linux-x64.rpm --header "Cookie: oraclelicense=accept-securebackup-cookie" "https://download.oracle.com/ otn-pub/java/jdk/8u181-b13/ 96a7b8442fe848ef90c96a2fad6ed6 d1/jre-8u181-linux-x64.rpm" - Check that the package was successfully downloaded:
rpm -qlp jre-8-linux-x64.rpm > /dev/null 2>&1 && echo "Java package downloaded successfully" || echo "Java package did not download successfully" - Install the package using
yum:yum -y install jre-8-linux-x64.rpm rm -f jre-8-linux-x64.rpm
Wazuh-agent troubleshooting guide.
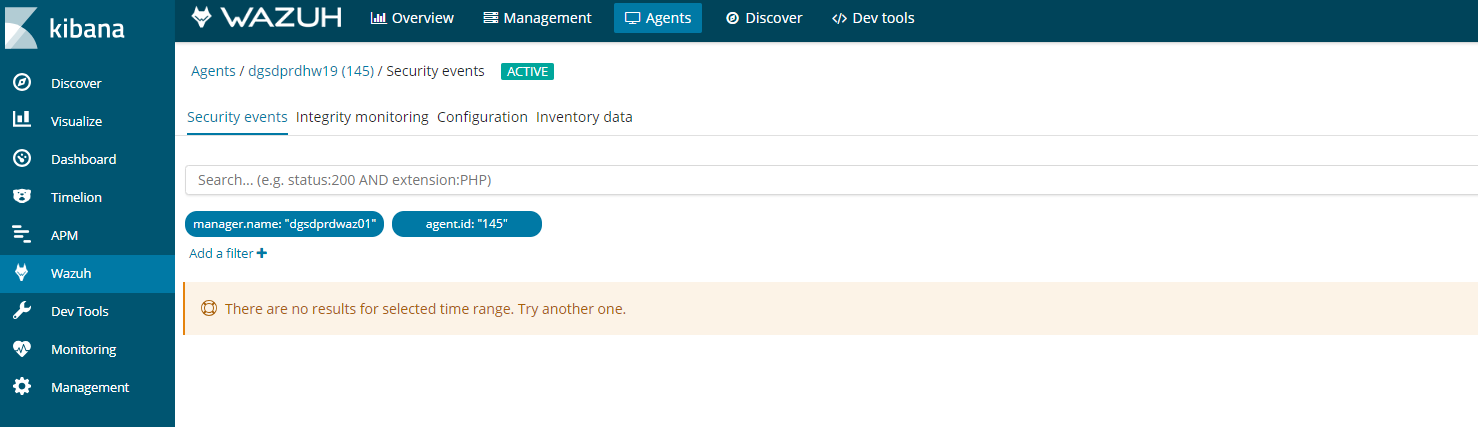
If you see this error in kibana on an agent. It could be for a number of reasons.
Follow this process to figure it out.
- Agent buffer on the client is full, which is caused by flood of alerts. The agents have a buffer size to keep resources on the clients consistent and minimal. If this fills up then kibana will stop collecting data.
- The first step is the easiest log into the client and restart the client by
- Systemctl restart wazuh-agent
- /etc/init.d/wazuh-agent restart
- And windows open the agent and click on restart
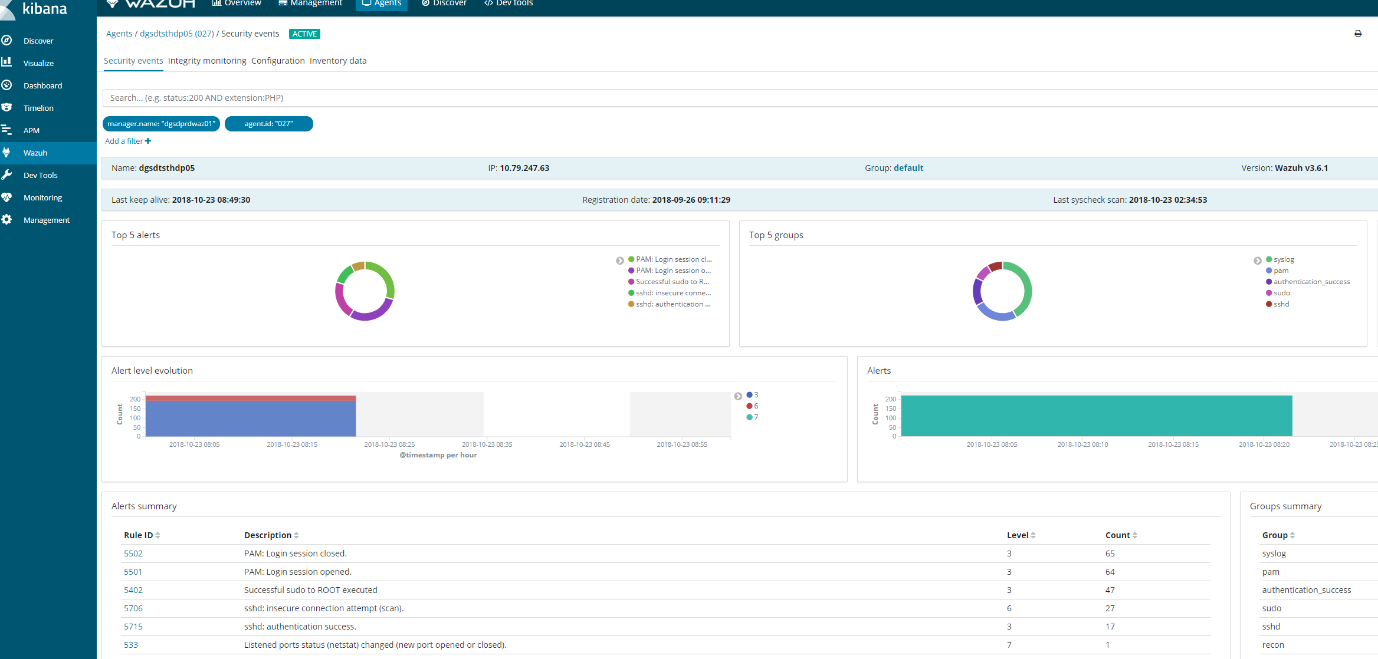
- If you go kibana
- Click on agents
- Then find your agent
- Click on a agent
- Click security audit
It should look something like this.
If this does not appear then we need to check wazuh-manager
Reason1 :Space issues
Logs can stop generating if elastic-search partition reaches 85% full and put the manager into read only mode.
# ls /usr/share/elasticsearch/data/ (lives on a different lvm)
# ls /var/ossec (lives on a different lvm)
-
- Ensure these partitions have plenty of space or wazuh will go into read only mode
- Ones you have ensure there is adequate space you will need to execute a command in kibana to get it working again.
PUT _settings{ “index“ : { “blocks.read_only“ : “false” }}
-
- In kibana, go to dev tools and put the above code and play the code.
Alternative command that does the same thing.
- curl –XPUT ‘http://localhost:9200/_settings‘ –H ‘Content-Type: application/json’ –d‘ { “index”: { “blocks”: { “read_only_allow_delete“: “false” } } } ‘
- Next restart wazuh-manager and ossec
- /var/ossec/bin/ossec-control restart
- Systemctl restart wazuh-manager
Reason 2: Ensure services are running and check versions
- Elasticsearch:curl –XGET ‘localhost:9200’
[root@waz01~]# curl localhost:9200/_cluster/health?pretty
{
“cluster_name” : “elasticsearch“,
“status” : “yellow”,
“timed_out” : false,
“number_of_nodes” : 1,
“number_of_data_nodes” : 1,
“active_primary_shards” : 563,
“active_shards” : 563,
“relocating_shards” : 0,
“initializing_shards” : 0,
“unassigned_shards” : 547,
“delayed_unassigned_shards” : 0,
“number_of_pending_tasks” : 0,
“number_of_in_flight_fetch” : 0,
“task_max_waiting_in_queue_millis” : 0,
“active_shards_percent_as_number” : 50.72072072072073
}
- Kibana:/usr/share/kibana/bin/kibana –V
[root@waz01 ~]# /usr/share/kibana/bin/kibana -V
6.4.0Logstash:/usr/share/logstash/bin/logstash –V
[root@waz01 ~]# /usr/share/logstash/bin/logstash -V
logstash 6.4.2
-
- Check to see if wazuh-manager and logstash are running
- systemctl status wazuh–manager
Active and working
[root@waz01 ~]#systemctl status wazuh-manager
● wazuh-manager.service – Wazuh manager
Loaded: loaded (/etc/systemd/system/wazuh-manager.service; enabled; vendor preset: disabled)
Active: active (running) since Thu 2018-10-18 12:25:53 BST; 4 days ago
Process: 4488 ExecStop=/usr/bin/env ${DIRECTORY}/bin/ossec-control stop (code=exited, status=0/SUCCESS)
Process: 4617 ExecStart=/usr/bin/env ${DIRECTORY}/bin/ossec-control start (code=exited, status=0/SUCCESS)
CGroup: /system.slice/wazuh-manager.service
├─4635 /var/ossec/bin/ossec-authd
├─4639 /var/ossec/bin/wazuh-db
├─4656 /var/ossec/bin/ossec-execd
├─4662 /var/ossec/bin/ossec-analysisd
├─4666 /var/ossec/bin/ossec-syscheckd
├─4672 /var/ossec/bin/ossec-remoted
├─4675 /var/ossec/bin/ossec-logcollector
├─4695 /var/ossec/bin/ossec-monitord
└─4699 /var/ossec/bin/wazuh-modulesd
Oct 18 12:25:51 waz01env[4617]: Started wazuh-db…
Oct 18 12:25:51 waz01env[4617]: Started ossec-execd…
Oct 18 12:25:51 waz01env[4617]: Started ossec-analysisd…
Oct 18 12:25:51 waz01env[4617]: Started ossec-syscheckd…
Oct 18 12:25:51 waz01env[4617]: Started ossec-remoted…
Oct 18 12:25:51 waz01env[4617]: Started ossec-logcollector…
Oct 18 12:25:51 waz01env[4617]: Started ossec-monitord…
Oct 18 12:25:51 waz01env[4617]: Started wazuh-modulesd…
Oct 18 12:25:53 waz01env[4617]: Completed.
Oct 18 12:25:53 waz01systemd[1]: Started Wazuh manager.
- systemctl status logstash
Active and working
[root@waz01~]#systemctl status logstash
● logstash.service – logstash
Loaded: loaded (/etc/systemd/system/logstash.service; enabled; vendor preset: disabled)
Active: active (running) since Mon 2018-10-15 23:44:21 BST; 1 weeks 0 days ago
Main PID: 11924 (java)
CGroup: /system.slice/logstash.service
└─11924 /bin/java -Xms1g -Xmx1g –XX:+UseParNewGC -XX:+UseConcMarkSweepGC –XX:CMSInitiatingOccupancyFraction=75 -XX:+UseCMSInitiatingOccupancyOnly –Djava.awt.headless=true –Dfile.encoding=UTF-8 –Djruby.compile.invokedynamic=true –Djruby.jit.threshold=0 -XX:+HeapDumpOnOutOfMemoryError –Djava.security.egd=file:/dev/urandom -cp /usr/share/logstash/logstash-core/lib/jars/animal-sniffer-annotations-1.14.jar:/usr/share/logstash/logstash-core/lib/jars/commons-codec-1.11.jar:/u…
Oct 15 23:44:41 waz01logstash[11924]: [2018-10-15T23:44:41,581][WARN ][logstash.outputs.elasticsearch] Detected a 6.x and above cluster: the `type` event field won’t be used to determine the document _type {:es_version=>6}
Oct 15 23:44:41 waz01logstash[11924]: [2018-10-15T23:44:41,604][INFO ][logstash.outputs.elasticsearch] New Elasticsearch output {:class=>”LogStash::Outputs::ElasticSearch“, :hosts=>[“//localhost:9200”]}
Oct 15 23:44:41 waz01logstash[11924]: [2018-10-15T23:44:41,616][INFO ][logstash.outputs.elasticsearch] Using mapping template from {:path=>nil}
Oct 15 23:44:41 waz01logstash[11924]: [2018-10-15T23:44:41,641][INFO ][logstash.outputs.elasticsearch] Attempting to install template {:manage_template=>{“template”=>”logstash-*”, “version”=>60001, “settings”=>{“index.refresh_interval“=>”5s”}, “mappings”=>{“_default_”=>{“dynamic_templates”=>[{“message_field”=>{“path_match”=>”mess
Oct 15 23:44:41 waz01logstash[11924]: [2018-10-15T23:44:41,662][INFO ][logstash.filters.geoip ] Using geoip database {:path=>”/usr/share/logstash/vendor/bundle/jruby/2.3.0/gems/logstash-filter-geoip-5.0.3-java/vendor/GeoLite2-City.mmdb”}
Oct 15 23:44:41 waz01logstash[11924]: [2018-10-15T23:44:41,925][INFO ][logstash.inputs.file ] No sincedb_path set, generating one based on the “path” setting {:sincedb_path=>”/var/lib/logstash/plugins/inputs/file/.sincedb_b6991da130c0919d87fbe36c3e98e363″, :path=>[“/var/ossec/logs/alerts/alerts.json“]}
Oct 15 23:44:41 waz01logstash[11924]: [2018-10-15T23:44:41,968][INFO ][logstash.pipeline ] Pipeline started successfully {:pipeline_id=>”main”, :thread=>”#<Thread:0x63e37301 sleep>”}
Oct 15 23:44:42 waz01logstash[11924]: [2018-10-15T23:44:42,013][INFO ][logstash.agent ] Pipelines running {:count=>1, :running_pipelines=>[:main], :non_running_pipelines=>[]}
Oct 15 23:44:42 waz01logstash[11924]: [2018-10-15T23:44:42,032][INFO ][filewatch.observingtail ] START, creating Discoverer, Watch with file and sincedb collections
Oct 15 23:44:42 waz01logstash[11924]: [2018-10-15T23:44:42,288][INFO ][logstash.agent ] Successfully started Logstash API endpoint {:port=>9600}
If any of these are failed restart them.
- systemctl restart logstashsystemctl restart elasticsearchsystemctl restart wazuh-manger
Reason 3: Logstash is broken
- Check the logs for errors.
- tail /var/log/logstash/logstash-plain.log
Possible error#1 :
[root@waz01 ~]# tail /var/log/logstash/logstash-plain.log
[2018-10-09T17:37:59,475][INFO ][logstash.outputs.elasticsearch] Retrying individual bulk actions that failed or were rejected by the previous bulk request. {:count=>1}
[2018-10-09T17:37:59,475][INFO ][logstash.outputs.elasticsearch] retrying failed action with response code: 403 ({“type”=>”cluster_block_exception“, “reason”=>”blocked by: [FORBIDDEN/12/index read-only / allow delete (api)];”})
[2018-10-09T17:37:59,475][INFO ][logstash.outputs.elasticsearch] retrying failed action with response code: 403 ({“type”=>”cluster_block_exception“, “reason”=>”blocked by: [FORBIDDEN/12/index read-only / allow delete (api)];”})
[2018-10-09T17:37:59,475][INFO ][logstash.outputs.elasticsearch] Retrying individual bulk actions that failed or were rejected by the previous bulk request. {:count=>2}
[2018-10-09T17:37:59,475][INFO ][logstash.outputs.elasticsearch] retrying failed action with response code: 403 ({“type”=>”cluster_block_exception“, “reason”=>”blocked by: [FORBIDDEN/12/index read-only / allow delete (api)];”})
[2018-10-09T17:37:59,475][INFO ][logstash.outputs.elasticsearch] Retrying individual bulk actions that failed or were rejected by the previous bulk request. {:count=>1}
[2018-10-09T17:37:59,475][INFO ][logstash.outputs.elasticsearch] Retrying individual bulk actions that failed or were rejected by the previous bulk request. {:count=>2}
[2018-10-09T17:37:59,475][INFO ][logstash.outputs.elasticsearch] Retrying individual bulk actions that failed or were rejected by the previous bulk request. {:count=>3}
[2018-10-09T17:37:59,476][INFO ][logstash.outputs.elasticsearch] retrying failed action with response code: 403 ({“type”=>”cluster_block_exception“, “reason”=>”blocked by: [FORBIDDEN/12/index read-only / allow delete (api)];”})
[2018-10-09T17:37:59,476][INFO ][logstash.outputs.elasticsearch] Retrying individual bulk actions that failed or were rejected by the previous bulk request. {:count=>1}
Possible error#2 :
[2018-10-15T20:06:10,967][ERROR][org.logstash.Logstash ] java.lang.IllegalStateException: Logstash stopped processing because of an error: (SystemExit) exit
[2018-10-15T20:06:26,863][FATAL][logstash.runner ] An unexpected error occurred! {:error=>#<ArgumentError: Path “/var/lib/logstash/queue” must be a writable directory. It is not writable.>, :backtrace=>[“/usr/share/logstash/logstash-core/lib/logstash/settings.rb:447:in `validate'”, “/usr/share/logstash/logstash-core/lib/logstash/settings.rb:229:in `validate_value‘”, “/usr/share/logstash/logstash-core/lib/logstash/settings.rb:140:in `block in validate_all‘”, “org/jruby/RubyHash.java:1343:in `each'”, “/usr/share/logstash/logstash-core/lib/logstash/settings.rb:139:in `validate_all‘”, “/usr/share/logstash/logstash-core/lib/logstash/runner.rb:278:in `execute'”, “/usr/share/logstash/vendor/bundle/jruby/2.3.0/gems/clamp-0.6.5/lib/clamp/command.rb:67:in `run'”, “/usr/share/logstash/logstash-core/lib/logstash/runner.rb:237:in `run'”, “/usr/share/logstash/vendor/bundle/jruby/2.3.0/gems/clamp-0.6.5/lib/clamp/command.rb:132:in `run'”, “/usr/share/logstash/lib/bootstrap/environment.rb:73:in `<main>'”]}
[2018-10-15T20:06:26,878][ERROR][org.logstash.Logstash ] java.lang.IllegalStateException: Logstash stopped processing because of an error: (SystemExit) exit
[2018-10-15T20:06:42,543][FATAL][logstash.runner ] An unexpected error occurred! {:error=>#<ArgumentError: Path “/var/lib/logstash/queue” must be a writable directory. It is not writable.>, :backtrace=>[“/usr/share/logstash/logstash-core/lib/logstash/settings.rb:447:in `validate'”, “/usr/share/logstash/logstash-core/lib/logstash/settings.rb:229:in `validate_value‘”, “/usr/share/logstash/logstash-core/lib/logstash/settings.rb:140:in `block in validate_all‘”, “org/jruby/RubyHash.java:1343:in `each'”, “/usr/share/logstash/logstash-core/lib/logstash/settings.rb:139:in `validate_all‘”, “/usr/share/logstash/logstash-core/lib/logstash/runner.rb:278:in `execute'”, “/usr/share/logstash/vendor/bundle/jruby/2.3.0/gems/clamp-0.6.5/lib/clamp/command.rb:67:in `run'”, “/usr/share/logstash/logstash-core/lib/logstash/runner.rb:237:in `run'”, “/usr/share/logstash/vendor/bundle/jruby/2.3.0/gems/clamp-0.6.5/lib/clamp/command.rb:132:in `run'”, “/usr/share/logstash/lib/bootstrap/environment.rb:73:in `<main>'”]}
[2018-10-15T20:06:42,557][ERROR][org.logstash.Logstash ] java.lang.IllegalStateException: Logstash stopped processing because of an error: (SystemExit) exit
[2018-10-15T20:06:58,344][FATAL][logstash.runner ] An unexpected error occurred! {:error=>#<ArgumentError: Path “/var/lib/logstash/queue” must be a writable directory. It is not writable.>, :backtrace=>[“/usr/share/logstash/logstash-core/lib/logstash/settings.rb:447:in `validate'”, “/usr/share/logstash/logstash-core/lib/logstash/settings.rb:229:in `validate_value‘”, “/usr/share/logstash/logstash-core/lib/logstash/settings.rb:140:in `block in validate_all‘”, “org/jruby/RubyHash.java:1343:in `each'”, “/usr/share/logstash/logstash-core/lib/logstash/settings.rb:139:in `validate_all‘”, “/usr/share/logstash/logstash-core/lib/logstash/runner.rb:278:in `execute'”, “/usr/share/logstash/vendor/bundle/jruby/2.3.0/gems/clamp-0.6.5/lib/clamp/command.rb:67:in `run'”, “/usr/share/logstash/logstash-core/lib/logstash/runner.rb:237:in `run'”, “/usr/share/logstash/vendor/bundle/jruby/2.3.0/gems/clamp-0.6.5/lib/clamp/command.rb:132:in `run'”, “/usr/share/logstash/lib/bootstrap/environment.rb:73:in `<main>'”]}
[2018-10-15T20:06:58,359][ERROR][org.logstash.Logstash ] java.lang.IllegalStateException: Logstash stopped processing because of an error: (SystemExit) exi
Probably need to reinstall logstash
1. Stop affected services:
# systemctl stop logstash# systemctl stop filebeat (this should not be installed on a stand alone setup as it causes performance issues.
2. Remove Filebeat
# yum remove filebeat
3. Setting up Logstash
# curl -so /etc/logstash/conf.d/01-wazuh.conf https://raw.githubusercontent.com/wazuh/wazuh/3.6/extensions/logstash/01-wazuh-local.conf# usermod -a -G osseclogstash
- Next step is to correct folder owner for certain Logstash directories:
# chown -R logstash:logstash /usr/share/logstash# chown -R logstash:logstash /var/lib/logstash
Note: if logstash still shows writing issues in the logs increase the permissions to
- chmod -R 766 /usr/share/logstash
- systemctl restart logstash
Now restart Logstash:
# systemctl restart logstash
5. Restart Logstash & run the curl command to ensure its not readonly.
- # systemctl restart logstash
- curl –XPUT ‘http://localhost:9200/_settings‘ –H ‘Content-Type: application/json’ –d‘ { “index”: { “blocks”: { “read_only_allow_delete“: “false” } } } ‘
- 6. Now check again your Logstash log file:
6. Now check again your Logstash log file:
# cat /var/log/logstash/logstash-plain.log | grep –i -E “(error|warning|critical)”
Hopefully you see no errors being generated
Next check the plain log
- tail -10 /var/log/logstash/logstash-plain.log
Good log output:
[root@waz01~]# tail -10 /var/log/logstash/logstash-plain.log
[2018-10-15T23:44:41,581][WARN ][logstash.outputs.elasticsearch] Detected a 6.x and above cluster: the `type` event field won’t be used to determine the document _type {:es_version=>6}
[2018-10-15T23:44:41,604][INFO ][logstash.outputs.elasticsearch] New Elasticsearch output {:class=>”LogStash::Outputs::ElasticSearch“, :hosts=>[“//localhost:9200”]}
[2018-10-15T23:44:41,616][INFO ][logstash.outputs.elasticsearch] Using mapping template from {:path=>nil}
[2018-10-15T23:44:41,641][INFO ][logstash.outputs.elasticsearch] Attempting to install template {:manage_template=>{“template”=>”logstash-*”, “version”=>60001, “settings”=>{“index.refresh_interval“=>”5s”}, “mappings”=>{“_default_”=>{“dynamic_templates”=>[{“message_field”=>{“path_match”=>”message”, “match_mapping_type“=>”string”, “mapping”=>{“type”=>”text”, “norms”=>false}}}, {“string_fields“=>{“match”=>”*”, “match_mapping_type“=>”string”, “mapping”=>{“type”=>”text”, “norms”=>false, “fields”=>{“keyword”=>{“type”=>”keyword”, “ignore_above“=>256}}}}}], “properties”=>{“@timestamp”=>{“type”=>”date”}, “@version”=>{“type”=>”keyword”}, “geoip“=>{“dynamic”=>true, “properties”=>{“ip“=>{“type”=>”ip“}, “location”=>{“type”=>”geo_point“}, “latitude”=>{“type”=>”half_float“}, “longitude”=>{“type”=>”half_float“}}}}}}}}
[2018-10-15T23:44:41,662][INFO ][logstash.filters.geoip ] Using geoip database {:path=>”/usr/share/logstash/vendor/bundle/jruby/2.3.0/gems/logstash-filter-geoip-5.0.3-java/vendor/GeoLite2-City.mmdb”}
[2018-10-15T23:44:41,925][INFO ][logstash.inputs.file ] No sincedb_path set, generating one based on the “path” setting {:sincedb_path=>”/var/lib/logstash/plugins/inputs/file/.sincedb_b6991da130c0919d87fbe36c3e98e363″, :path=>[“/var/ossec/logs/alerts/alerts.json“]}
[2018-10-15T23:44:41,968][INFO ][logstash.pipeline ] Pipeline started successfully {:pipeline_id=>”main”, :thread=>”#<Thread:0x63e37301 sleep>”}
[2018-10-15T23:44:42,013][INFO ][logstash.agent ] Pipelines running {:count=>1, :running_pipelines=>[:main], :non_running_pipelines=>[]}
[2018-10-15T23:44:42,032][INFO ][filewatch.observingtail ] START, creating Discoverer, Watch with file and sincedb collections
[2018-10-15T23:44:42,288][INFO ][logstash.agent ] Successfully started Logstash API endpoint {:port=>9600}
Now that we have all clear, let’s check component by component:
1. Check last 10 alerts generated in your Wazuh manager. Also, check the field timestamp, we must take care about the timestamp.
tail –10 /var/ossec/logs/alerts/alerts.json
2. If the Wazuh manager is generating alerts from your view (step 1), then let’s check if Logstash is reading our alerts. You should see two processes: java for Logstash and ossec-ana from Wazuh.
# lsof /var/ossec/logs/alerts/alerts.json (ossec-ana & java should be running if not restart ossec)
[root@waz01~]#lsof /var/ossec/logs/alerts/alerts.json
COMMAND PID USER FD TYPE DEVICE SIZE/OFF NODE NAME
ossec-ana 4662ossec 10w REG 253,3 2060995503 201341089 /var/ossec/logs/alerts/alerts.json
java 11924 logstash 93r REG 253,3 2060995503 201341089 /var/ossec/logs/alerts/alerts.json
3. If Logstash is reading our alerts, let’s check if there is an Elasticsearch index for today (wazuh-alerts-3.x-2018.10.16)):
curl localhost:9200/_cat/indices/wazuh–alerts–3.x-*
[root@waz01~]# curl localhost:9200/_cat/indices/wazuh-alerts-3.x-*
yellow open wazuh-alerts-3.x-2018.09.07 HLNDuMjHS1Ox3iLoSwFE7g 5 1 294 0 1000.8kb 1000.8kb
yellow open wazuh-alerts-3.x-2018.09.25 Eg1rvDXbSNSq5EqJAtSm_A 5 1 247998 0 87.7mb 87.7mb
yellow open wazuh-alerts-3.x-2018.09.05 HHRnxqjtTKimmW6FEUUfdw 5 1 143 0 679.6kb 679.6kb
yellow open wazuh-alerts-3.x-2018.09.08 MqIJtCNQR3aU3inuv-pxpw 5 1 183 0 748kb 748kb
yellow open wazuh-alerts-3.x-2018.09.15 GIx8fMXnQ3ukrSkKmjbViQ 5 1 171191 0 45.9mb 45.9mb
yellow open wazuh-alerts-3.x-2018.10.10 W3pw1hDwSp2QAtRm0hwoaQ 5 1 896799 0 662.6mb 662.6mb
yellow open wazuh-alerts-3.x-2018.10.15 rnC7kyXRQSCSXm6wVCiWOw 5 1 2628257 0 1.8gb 1.8gb
yellow open wazuh-alerts-3.x-2018.10.02 nKEdjkFOQ9abitVi_dKF3g 5 1 727934 0 232.7mb 232.7mb
yellow open wazuh-alerts-3.x-2018.09.21 FY0mIXGQQHmCpYgRgOIJhg 5 1 203134 0 63.5mb 63.5mb
yellow open wazuh-alerts-3.x-2018.10.01 mvYSVDZJSfa-F_5dKIBwAg 5 1 402155 0 129.9mb 129.9mb
yellow open wazuh-alerts-3.x-2018.10.18 _2WiGz6fRXSNyDjy8qPefg 5 1 2787147 0 1.8gb 1.8gb
yellow open wazuh-alerts-3.x-2018.09.19 ebb9Jrt1TT6Qm6df7VjZxg 5 1 201897 0 58.3mb 58.3mb
yellow open wazuh-alerts-3.x-2018.09.13 KPy8HfiyRyyPeeHpTGKJNg 5 1 52530 0 13.7mb 13.7mb
yellow open wazuh-alerts-3.x-2018.10.23 T7YJjWhgRMaYyCT-XC1f5w 5 1 1074081 0 742.6mb 742.6mb
yellow open wazuh-alerts-3.x-2018.10.03 bMW_brMeRkSDsJWL6agaWg 5 1 1321895 0 715mb 715mb
yellow open wazuh-alerts-3.x-2018.09.18 B1wJIN1SQKuSQbkoFsTmnA 5 1 187805 0 52.4mb 52.4mb
yellow open wazuh-alerts-3.x-2018.09.04 CvatsnVxTDKgtPzuSkebFQ 5 1 28 0 271.1kb 271.1kb
yellow open wazuh-alerts-3.x-2018.10.21 AWVQ7D8VS_S0DHiXvtNB1Q 5 1 2724453 0 1.8gb 1.8gb
yellow open wazuh-alerts-3.x-2018.09.27 8wRF0XhXQnuVexAxLF6Y5w 5 1 233117 0 79.2mb 79.2mb
yellow open wazuh-alerts-3.x-2018.10.13 wM5hHYMCQsG5XCkIquE-QA 5 1 304830 0 222.4mb 222.4mb
yellow open wazuh-alerts-3.x-2018.09.12 1aB7pIcnTWqZPZkFagHnKA 5 1 73 0 516kb 516kb
yellow open wazuh-alerts-3.x-2018.09.29 BXyZe2eySkSlwutudcTzNA 5 1 222734 0 73.7mb 73.7mb
yellow open wazuh-alerts-3.x-2018.10.04 x8198rpWTxOVBgJ6eTjJJg 5 1 492044 0 364.9mb 364.9mb
yellow open wazuh-alerts-3.x-2018.09.23 ZQZE9KD1R1y6WypYVV5kfg 5 1 216141 0 73.7mb 73.7mb
yellow open wazuh-alerts-3.x-2018.09.22 60AsCkS-RGG0Z2kFGcrbxg 5 1 218077 0 74.2mb 74.2mb
yellow open wazuh-alerts-3.x-2018.10.12 WdiFnzu7QlaBetwzcsIFYQ 5 1 363029 0 237.7mb 237.7mb
yellow open wazuh-alerts-3.x-2018.09.24 Loa8kM7cSJOujjRzvYsVKw 5 1 286140 0 106.3mb 106.3mb
yellow open wazuh-alerts-3.x-2018.09.17 zK3MCinOSF2_3rNAJnuPCQ 5 1 174254 0 48.3mb 48.3mb
yellow open wazuh-alerts-3.x-2018.10.17 A4yCMv4YTuOQWelbb3XQtQ 5 1 2703251 0 1.8gb 1.8gb
yellow open wazuh-alerts-3.x-2018.09.02 lt8xvq2ZRdOQGW7pSX5-wg 5 1 148 0 507kb 507kb
yellow open wazuh-alerts-3.x-2018.08.31 RP0_5r1aQdiMmQYeD0-3CQ 5 1 28 0 247.8kb 247.8kb
yellow open wazuh-alerts-3.x-2018.09.28 iZ2J4UMhR6y1eHH1JiiqLQ 5 1 232290 0 78.6mb 78.6mb
yellow open wazuh-alerts-3.x-2018.09.09 FRELA8dFSWy6aMd12ZFnqw 5 1 428 0 895.1kb 895.1kb
yellow open wazuh-alerts-3.x-2018.09.16 uwLNlaQ1Qnyp2V9jXJJHvA 5 1 171478 0 46.5mb 46.5mb
yellow open wazuh-alerts-3.x-2018.10.14 WQV3dpLeSdapmaKOewUh-Q 5 1 226964 0 154.9mb 154.9mb
yellow open wazuh-alerts-3.x-2018.09.11 2Zc4Fg8lR6G64XuJLZbkBA 5 1 203 0 772.1kb 772.1kb
yellow open wazuh-alerts-3.x-2018.10.16 p2F-trx1R7mBXQUb4eY-Fg 5 1 2655690 0 1.8gb 1.8gb
yellow open wazuh-alerts-3.x-2018.08.29 kAPHZSRpQqaMhoWgkiXupg 5 1 28 0 236.6kb 236.6kb
yellow open wazuh-alerts-3.x-2018.08.28 XmD43PlgTUWaH4DMvZMiqw 5 1 175 0 500.9kb 500.9kb
yellow open wazuh-alerts-3.x-2018.10.19 O4QFPk1FS1urV2CGM2Ul4g 5 1 2718909 0 1.8gb 1.8gb
4. If Elasticsearch has an index for today (wazuh-alerts-3.x-2018.10.16), the problem is probably selected time range in Kibana. To discard any error related to this, please go to Kibana > Discover, and look for
alerts in that section of Kibana itself. If there are alerts from today in the Discover section.
This means the Elasticsearch stack is finally working (at least at index level)
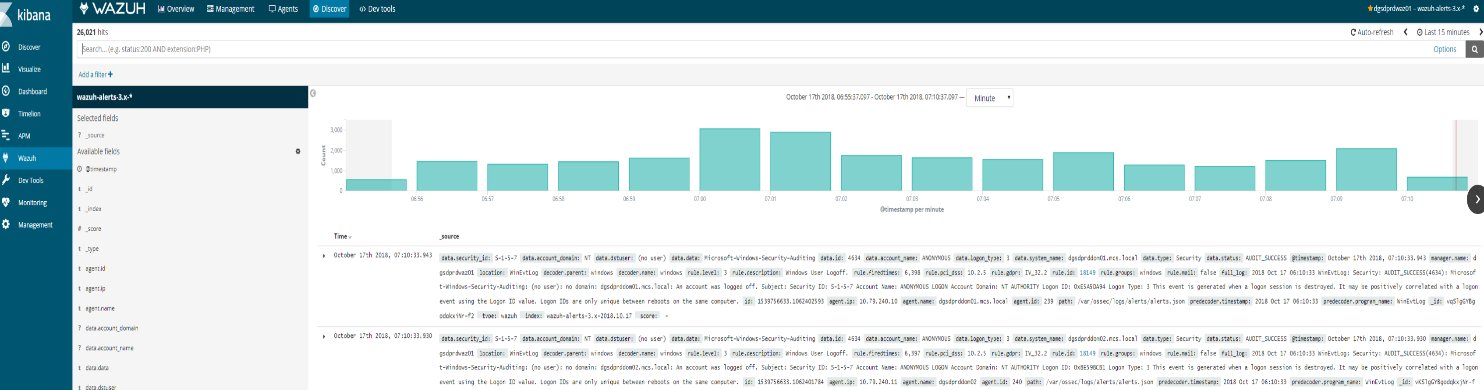
Reason 4: Agent buffer is full due to flood events. If this occurs events are not logged and data is lost. We want to drill down on a specific agent to figure out what is causing the issue.
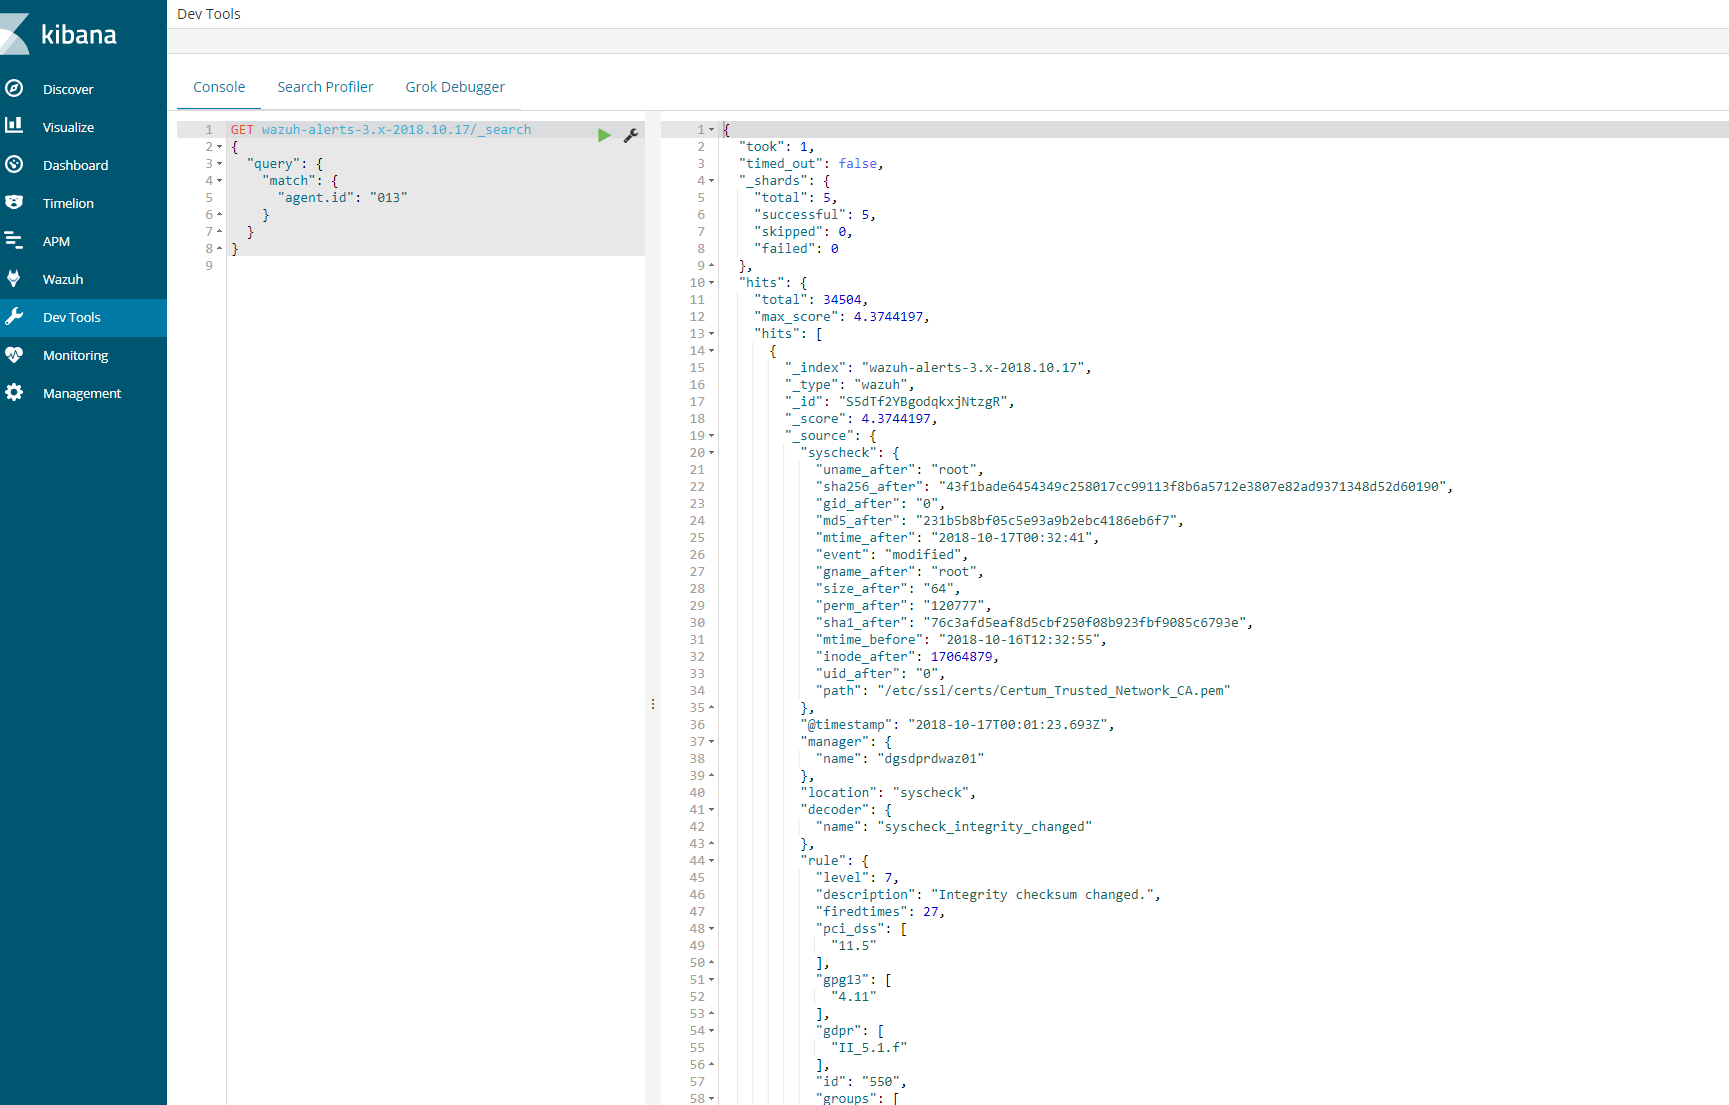
Try to fetch data directly from Elasticsearch for the today’s index and for the agent 013. Copy and paste the next query in the Kibana dev tools:
GET wazuh–alerts–3.x–2018.10.17/_search{ “query”: { “match”: { “agent.id“: “013” } }}
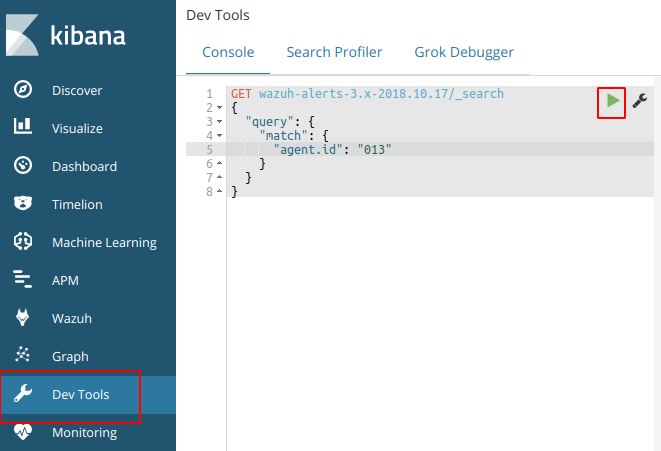
This should provide a log an output to show that the agent is logged in the indices for that day. If this is successful then we know that the logs are coming and kibana is able to communicate.
Next steps
- Login using SSH into the agent “013” and execute the next command:
wc –l /var/log/audit/audit.log cut –d‘/’ –f1 (centos)
wc –l /var/log/audit/syslog cut –d‘/’ f1(ubuntu)
- root@wazuh-03:/var/log# wc -l /var/log/syslog | cut -d’/’ -f1
- 36451
36451
Also, it would be nice if you provide us your audit rules, let’s check them using the next command:
# auditctl -l
It should show you a positive number, and that number is the number of lines in the audit.log file. Note down it.
- Now restart the Wazuh agent:
# systemctl restart wazuh-agent
We need to wait for syscheck scan is finished, this trick is useful to know exactly when it’s done:
# tail -f /var/ossec/logs/ossec.log | grep syscheck | grep Ending
The above command shouldn’t show anything until the scan is finished (it could take some time, be patient please). At the end, you should see a line like this:
2018/10/17 13:36:03 ossec–syscheckd: INFO: Ending syscheck scan (forwarding database).
Now, it’s time for checking the audit.log file again:
wc –l /var/log/audit/audit.log cut –d‘/’ –f1
wc –l /var/log/audit/syslog cut –d‘/’ f1
If you still see the agent buffer full after these steps then we need to do debugging.
tail -f /var/ossec/logs/ossec.log | grep syscheck | grep Ending
root@waz03:/var/log# cat /var/ossec/logs/ossec.log | grep –i -E “(error|warning|critical)”
2018/10/17 00:09:08 ossec-agentd: WARNING: Agent buffer at 90 %.
2018/10/17 00:09:08 ossec-agentd: WARNING: Agent buffer is full: Events may be lost.
2018/10/17 12:10:20 ossec-agentd: WARNING: Agent buffer at 90 %.
2018/10/17 12:10:20 ossec-agentd: WARNING: Agent buffer is full: Events may be lost.
2018/10/17 14:25:20 ossec-logcollector: ERROR: (1103): Could not open file ‘/var/log/messages’ due to [(2)-(No such file or directory)].
2018/10/17 14:25:20 ossec-logcollector: ERROR: (1103): Could not open file ‘/var/log/secure’ due to [(2)-(No such file or directory)].
2018/10/17 14:26:08 ossec-agentd: WARNING: Agent buffer at 90 %.
2018/10/17 14:26:08 ossec-agentd: WARNING: Agent buffer is full: Events may be lost.
2018/10/17 14:28:18 ossec-logcollector: ERROR: (1103): Could not open file ‘/var/log/messages’ due to [(2)-(No such file or directory)].
2018/10/17 14:28:18 ossec-logcollector: ERROR: (1103): Could not open file ‘/var/log/secure’ due to [(2)-(No such file or directory)].
2018/10/17 14:29:06 ossec-agentd: WARNING: Agent buffer at 90 %.
2018/10/17 14:29:06 ossec-agentd: WARNING: Agent buffer is full: Events may be lost.
Debugging json alerts for specific agent 13
Ok, let’s debug your agent events using logall_json in the Wazuh manager instance.
Login using SSH into the Wazuh manager instance and edit the ossec.conf file.
- Edit the file /var/ossec/etc/ossec.conf and look for the <global> section, then enable <logall_json>
<logall_json>yes</logall_json>
2. Restart the Wazuh manager
# systemctl restart wazuh-manager
3. Login using SSH into the Wazuhagent(13) instance, restart it and tail -f until it shows you the warning message:
# systemctl restart wazuh-agent# tail -f /var/ossec/logs/ossec.log | grep WARNING
4. Once you see ossec-agentd: WARNING: Agent buffer at 90 %. in the Wazuh agent logs,
then switch your CLI to the Wazuh manager instance again and
the next file we want to tail is from your Wazuh manager:
tail –f /var/ossec/logs/archives/archives.json
5. Now we can take a look into events in order to clarify what is flooding the agent “013”.
Once you have the log is seen, you can disable logall_json and restart the Wazuh manager.
6.
Log from tail –f /var/ossec/logs/archives/archives.json (wazuh-manager)
{“timestamp”:”2018-10-17T18:06:17.33+0100″,”rule”:{“level”:7,”description”:”Host-based anomaly detection event (rootcheck).”,”id”:”510″,”firedtimes”:3352,”mail”:false,”groups”:[“ossec”,”rootcheck”],”gdpr”:[“IV_35.7.d”]},”agent”:{“id”:”013″,”na
me”:”waz03“,”ip”:”10.79.244.143″},”manager”:{“name”:”waz01“},”id”:”1539795977.2752038221″,“full_log”:”File ‘/var/lib/kubelet/pods/2ff462ce-7233-11e8-8282-005056b518e6/containers/install-cni/e26aa5b1’ is owned by root and has written permissions to anyone.”,”decoder“:{“name”:”rootcheck“},”data”:{“title”:”File is owned by root and has written permissions to anyone.”,”file”:”/var/lib/kubelet/pods/2ff462ce-7233-11e8-8282-005056b518e6/containers/install-cni/e26aa5b1″},”location”:”rootcheck”}
{“timestamp”:”2018-10-17T18:06:17.35+0100″,”rule”:{“level”:7,”description”:”Host-based anomaly detection event (rootcheck).”,”id”:”510″,”firedtimes”:3353,”mail”:false,”groups”:[“ossec”,”rootcheck”],”gdpr”:[“IV_35.7.d”]},”agent”:{“id”:”013″,”name”:”waz03“,”ip”:”10.79.244.143″},”manager”:{“name”:”waz01“},”id”:”1539795977.2752038739″,”full_log”:”File ‘/var/lib/kubelet/pods/2ff462ce-7233-11e8-8282-005056b518e6/containers/install-cni/12cb9011’ is owned by root and has written permissions to anyone.”,”decoder“:{“name”:”rootcheck“},”data”:{“title”:”File is owned by root and has written permissions to anyone.”,”file”:”/var/lib/kubelet/pods/2ff462ce-7233-11e8-8282-005056b518e6/containers/install-cni/12cb9011″},”location”:”rootcheck”}
{“timestamp”:”2018-10-17T18:06:17.37+0100″,”rule”:{“level”:7,”description”:”Host-based anomaly detection event (rootcheck).”,”id”:”510″,”firedtimes”:3354,”mail”:false,”groups”:[“ossec”,”rootcheck”],”gdpr”:[“IV_35.7.d”]},”agent”:{“id”:”013″,”name”:”waz03“,”ip”:”10.79.244.143″},”manager”:{“name”:”waz01“},”id”:”1539795977.2752039257″,”full_log”:”File ‘/var/lib/kubelet/pods/2ff462ce-7233-11e8-8282-005056b518e6/containers/install-cni/4a930107’ is owned by root and has written permissions to anyone.”,”decoder“:{“name”:”rootcheck“},”data”:{“title”:”File is owned by root and has written permissions to anyone.”,”file”:”/var/lib/kubelet/pods/2ff462ce-7233-11e8-8282-005056b518e6/containers/install-cni/4a930107″},”location”:”rootcheck”}
{“timestamp”:”2018-10-17T18:06:17.40+0100″,”rule“:{“level”:7,”description”:”Host-based anomaly detection event
From the above log we can see that kubernetes is sending a lot of events to the agent causing the buffer to fill up. To solve this we particular issue from happening in future. We can disable this at the client level or the global level.
Here you can see the number of events from rootcheck in your archives.json:
cat archives.json grep rootcheck wc –l489
Here you can see the number of events from rootcheck and rule 510 in thearchives.json:
cat archives.json grep rootcheck grep 510 wc –l489
Here you can see the number of events from rootcheck and rule 510 and including “/var/lib/kubelet/pods/“ in your archives.json:
cat archives.json grep rootcheck grep 510 grep /var/lib/kubelet/pods/ wc –l489
So we have two options:
Option 1. Edit the ossec.conf from your Wazuh agent “013”. (This is the one I did)
– Login using SSH into the Wazuh agent “013” instance.
– Edit the file /var/ossec/etc/ossec.conf, and look for the rootcheck block, then put a <ignore> block for that directory.
<rootcheck>…<ignore>/var/lib/kubelet</ignore>…</rootcheck>
Restart the Wazuh agent “013”
# systemctl restart wazuh-agent
Option 2. Check in which group is your agent and edit its centralized configuration.
– Login using SSH into the Wazuh manager instance.
– Check the group where is agent “013”
# /var/ossec/bin/agent_groups -s –i 013
– Note down the group, example: default
– Edit the file under /var/ossec/etc/shared/default/agent.conf (replace default by the real group name, it could be different from my example),
then add the rootcheck ignore inside the <agent_config> block, example:
<agent_config> <!– Shared agent configuration here –> <rootcheck> <ignore>/var/lib/kuberlet</ignore> </rootcheck></agent_config>
– Restart the Wazuh manager
# systemctl restart wazuh-manager
– Restart the agent on client as well
# systemctl restart wazuh–agent
The solution #1 takes effect immediately.
The solution #2 will push the new configuration from the Wazuh manager to the Wazuh agent, once the agent receives it,
it auto restarts itself automatically and then it applies the new configuration. It could take a bit more time than solution #1.
On a side note, you can take a look at this useful link about the agent flooding:
The above link talks about how to prevent from being flooded.
Now the agent should show correctly in the 15min time range. If a bunch of client had the issue then you need to use ansible to send out a agent restart on all clients or setup a cron on all the machines to restart the agent every 24 hours.
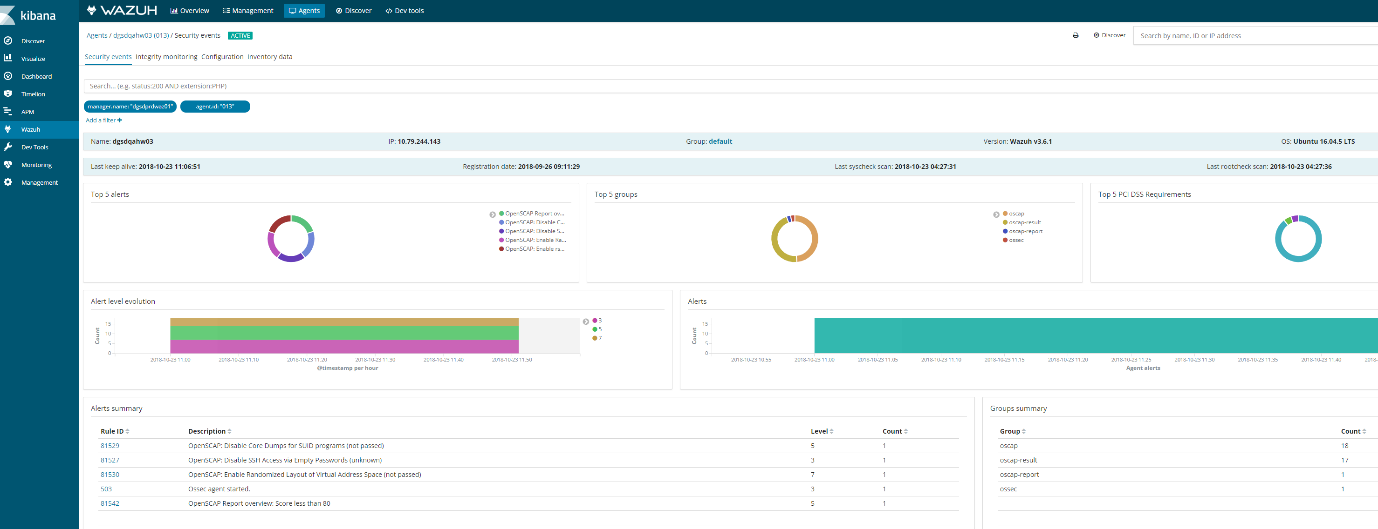
Discover on the agent should also show logs
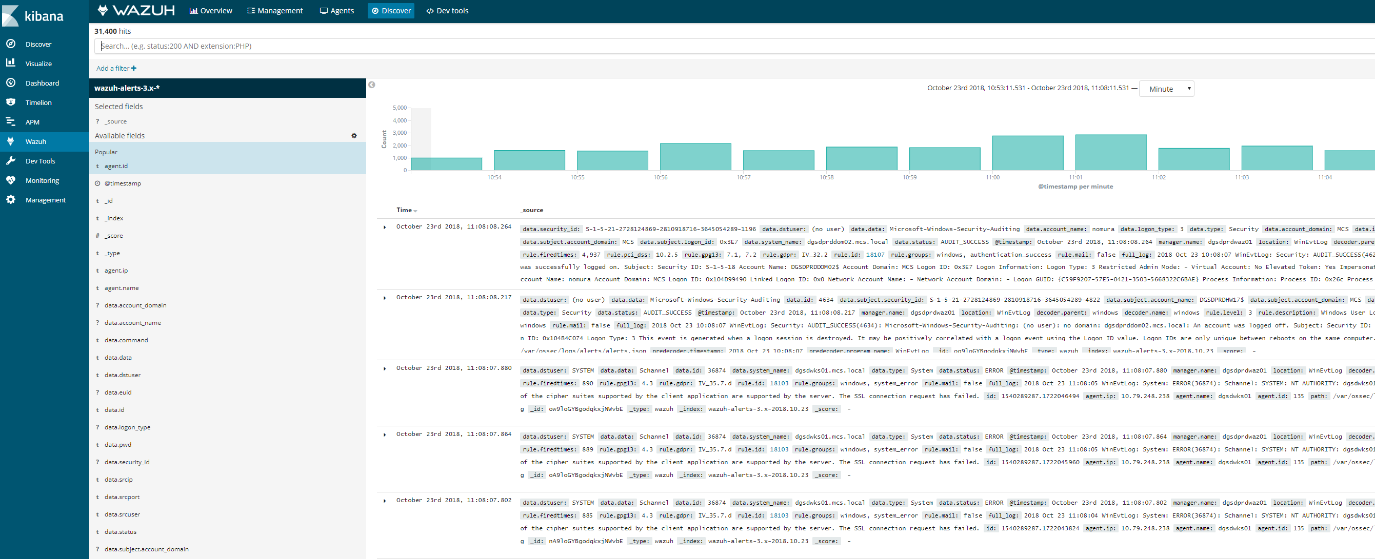
Ansible adhoc command or playbook.
Example:
- ansible –i hosts–linuxdevelopment -a “sudo systemctl restart wazuh-agent” –vault-password-file /etc/ansible/vaultpw.txt -u ansible_nickt -k -K
How to deploy wazuh-agent with Ansible
Note: For windows ports 5986 and 1515 must be open along with configureansiblescript.ps(powershell script) must have been setup for ansible to be able to communicate and deploy the wazuh-agent to windows machines.
In order to deploy the wazuh-agent to a large group of servers that span windows, ubuntu, centos type distros with ansible. Some tweaks need to be made on the wazuh manager and ansible server
This is done on the wazuh-manager server
/var/ossec/etc/ossec.conf – inside this file the following need to be edited for registrations to have the proper ip of the hosts being registered
<auth>
<disabled>no</disabled>
<port>1515</port>
<use_source_ip>yes</use_source_ip>
<force_insert>yes</force_insert>
<force_time>0</force_time>
<purge>yes</purge>
<use_password>yes</use_password>
<limit_maxagents>no</limit_maxagents>
<ciphers>HIGH:!ADH:!EXP:!MD5:RC4:3DES:!CAMELLIA:@STRENGTH</ciphers>
<!– <ssl_agent_ca></ssl_agent_ca> –>
<ssl_verify_host>no</ssl_verify_host>
<ssl_manager_cert>/var/ossec/etc/sslmanager.cert</ssl_manager_cert>
<ssl_manager_key>/var/ossec/etc/sslmanager.key</ssl_manager_key>
<ssl_auto_negotiate>yes</ssl_auto_negotiate>
</auth>
To enable authd on wazuh-manager
Now on your ansible server
wazuh_managers:
– address: 10.79.240.160
port: 1514
protocol: tcp
api_port: 55000
api_proto: ‘http’
api_user: null
wazuh_profile: null
wazuh_auto_restart: ‘yes’
wazuh_agent_authd:
enable: true
port: 1515
Next section in main.yml
openscap:
disable: ‘no’
timeout: 1800
interval: ‘1d’
scan_on_start: ‘yes’
# We recommend the use of Ansible Vault to protect Wazuh, api, agentless and authd credentials.
authd_pass: ‘password’
Test communication to windows machines via ansible run the following from /etc/ansible
How to run he playbook on linux machines, run from /etc/ansible/playbook/
How to run playbook on windows
Ansible playbook-roles-tasks breakdown
:/etc/ansible/playbooks# cat wazuh-agent.ymlplaybook file
– hosts: all:!wazuh-manager
roles:
– ansible-wazuh-agentroles that is called
vars:
wazuh_managers:
– address: 192.168.10.10
port: 1514
protocol: udp
api_port: 55000
api_proto: ‘http’
api_user: ansible
wazuh_agent_authd:
enable: true
port: 1515
ssl_agent_ca: null
ssl_auto_negotiate: ‘no
Roles: ansible-wazuh-agent
:/etc/ansible/roles/ansible-wazuh-agent/tasks# cat Linux.yml
—
– import_tasks: “RedHat.yml”
when: ansible_os_family == “RedHat”
– import_tasks: “Debian.yml”
when: ansible_os_family == “Debian”
– name: Linux | Install wazuh-agent
become: yes
package: name=wazuh-agent state=present
async: 90
poll: 15
tags:
– init
– name: Linux | Check if client.keys exists
become: yes
stat: path=/var/ossec/etc/client.keys
register: check_keys
tags:
– config
This task I added. If the client.keys file exists the registration on linux simply skips over when the playbook runs. You may want to disable this later, however when deploying to new machines probably best to have it active
– name: empty client key file
become: yes
command: rm -f /var/ossec/etc/client.keys
command: touch /var/ossec/etc/client.keys
– name: Linux | Agent registration via authd
block:
– name: Retrieving authd Credentials
include_vars: authd_pass.yml
tags:
– config
– authd
– name: Copy CA, SSL key and cert for authd
copy:
src: “{{ item }}”
dest: “/var/ossec/etc/{{ item | basename }}”
mode: 0644
with_items:
– “{{ wazuh_agent_authd.ssl_agent_ca }}”
– “{{ wazuh_agent_authd.ssl_agent_cert }}”
– “{{ wazuh_agent_authd.ssl_agent_key }}”
tags:
– config
– authd
when:
– wazuh_agent_authd.ssl_agent_ca is not none
This section below is the most important section as this what registers the machine to wazuh, if this section is skipped its usually due to client.keys file. I have made adjustments from the original git repository as I found it had some issues.
– name: Linux | Register agent (via authd)
shell: >
/var/ossec/bin/agent-auth
-m {{ wazuh_managers.0.address }}
-p {{ wazuh_agent_authd.port }}
{% if authd_pass is defined %}-P {{ authd_pass }}{% endif %}
{% if wazuh_agent_authd.ssl_agent_ca is not none %}
-v “/var/ossec/etc/{{ wazuh_agent_authd.ssl_agent_ca | basename }}”
-x “/var/ossec/etc/{{ wazuh_agent_authd.ssl_agent_cert | basename }}”
-k “/var/ossec/etc/{{ wazuh_agent_authd.ssl_agent_key | basename }}”
{% endif %}
{% if wazuh_agent_authd.ssl_auto_negotiate == ‘yes’ %}-a{% endif %}
become: yes
register: agent_auth_output
when:
– check_keys.stat.size == 0
– wazuh_managers.0.address is not none
tags:
– config
– authd
– name: Linux | Verify agent registration
shell: echo {{ agent_auth_output }} | grep “Valid key created”
when:
– check_keys.stat.size == 0
– wazuh_managers.0.address is not none
tags:
– config
– authd
when: wazuh_agent_authd.enable == true
– name: Linux | Agent registration via rest-API
block:
– name: Retrieving rest-API Credentials
include_vars: api_pass.yml
tags:
– config
– api
– name: Linux | Create the agent key via rest-API
uri:
url: “{{ wazuh_managers.0.api_proto }}://{{ wazuh_managers.0.address }}:{{ wazuh_managers.0.api_port }}/agents/”
validate_certs: no
method: POST
body: {“name”:”{{ inventory_hostname }}”}
body_format: json
status_code: 200
headers:
Content-Type: “application/json”
user: “{{ wazuh_managers.0.api_user }}”
password: “{{ api_pass }}”
register: newagent_api
changed_when: newagent_api.json.error == 0
when:
– check_keys.stat.size == 0
– wazuh_managers.0.address is not none
become: no
tags:
– config
– api
– name: Linux | Retieve new agent data via rest-API
uri:
url: “{{ wazuh_managers.0.api_proto }}://{{ wazuh_managers.0.address }}:{{ wazuh_managers.0.api_port }}/agents/{{ newagent_api.json.data.id }}”
validate_certs: no
method: GET
return_content: yes
user: “{{ wazuh_managers.0.api_user }}”
password: “{{ api_pass }}”
when:
– check_keys.stat.size == 0
– wazuh_managers.0.address is not none
– newagent_api.json.error == 0
register: newagentdata_api
delegate_to: localhost
become: no
tags:
– config
– api
– name: Linux | Register agent (via rest-API)
command: /var/ossec/bin/manage_agents
environment:
OSSEC_ACTION: i
OSSEC_AGENT_NAME: ‘{{ newagentdata_api.json.data.name }}’
OSSEC_AGENT_IP: ‘{{ newagentdata_api.json.data.ip }}’
OSSEC_AGENT_ID: ‘{{ newagent_api.json.data.id }}’
OSSEC_AGENT_KEY: ‘{{ newagent_api.json.data.key }}’
OSSEC_ACTION_CONFIRMED: y
register: manage_agents_output
when:
– check_keys.stat.size == 0
– wazuh_managers.0.address is not none
– newagent_api.changed
tags:
– config
– api
notify: restart wazuh-agent
when: wazuh_agent_authd.enable == false
– name: Linux | Vuls integration deploy (runs in background, can take a while)
command: /var/ossec/wodles/vuls/deploy_vuls.sh {{ ansible_distribution|lower }} {{ ansible_distribution_major_version|int }}
args:
creates: /var/ossec/wodles/vuls/config.toml
async: 3600
poll: 0
when:
– wazuh_agent_config.vuls.disable != ‘yes’
– ansible_distribution == ‘Redhat’ or ansible_distribution == ‘CentOS’ or ansible_distribution == ‘Ubuntu’ or ansible_distribution == ‘Debian’ or ansible_distribution == ‘Oracle’
tags:
– init
– name: Linux | Installing agent configuration (ossec.conf)
become: yes
template: src=var-ossec-etc-ossec-agent.conf.j2
dest=/var/ossec/etc/ossec.conf
owner=root
group=ossec
mode=0644
notify: restart wazuh-agent
tags:
– init
– config
– name: Linux | Ensure Wazuh Agent service is restarted and enabled
become: yes
service:
name: wazuh-agent
enabled: yes
state: restarted
– import_tasks: “RMRedHat.yml”
when: ansible_os_family == “RedHat”
– import_tasks: “RMDebian.yml”
when: ansible_os_family == “Debian”
Windows- tasks
Note: This section only works if your ansible is configured to communicate with Windows machines. It requires that port 5986 from ansible to windows is open and then port 1515 from the window machine to the wazuh-manager is open.
Problems: When using authd and Kerberos for windows ensure you have the host name listed in /etc/hosts on the ansible server to help alleviate agent deployment issues. Its script does not seem to handle well when you have more than 5 or 6 clients at a time at least in my experience.
Either I had to rejoint the windows machine to the domain or remove the client.keys file. I have updated this task to include the task to remove the client.keys file before it check to see if it exists. You do need to play with it a bit sometimes. I have also added a section that adds the wazuh-agent as a service and restarts it upon deployment as I found it sometimes skipped this entirely.
:/etc/ansible/roles/ansible-wazuh-agent/tasks# cat Windows.yml
—
– name: Windows | Get current installed version
win_shell: “{{ wazuh_winagent_config.install_dir }}ossec-agent.exe -h”
args:
removes: “{{ wazuh_winagent_config.install_dir }}ossec-agent.exe”
register: agent_version
failed_when: False
changed_when: False
– name: Windows | Check Wazuh agent version installed
set_fact: correct_version=true
when:
– agent_version.stdout is defined
– wazuh_winagent_config.version in agent_version.stdout
– name: Windows | Downloading windows Wazuh agent installer
win_get_url:
dest: C:\wazuh-agent-installer.msi
url: “{{ wazuh_winagent_config.repo }}wazuh-agent-{{ wazuh_winagent_config.version }}-{{ wazuh_winagent_config.revision }}.msi”
when:
– correct_version is not defined
– name: Windows | Verify the downloaded Wazuh agent installer
win_stat:
path: C:\wazuh-agent-installer.msi
get_checksum: yes
checksum_algorithm: md5
register: installer_md5
when:
– correct_version is not defined
failed_when:
– installer_md5.stat.checksum != wazuh_winagent_config.md5
– name: Windows | Install Wazuh agent
win_package:
path: C:\wazuh-agent-installer.msi
arguments: APPLICATIONFOLDER={{ wazuh_winagent_config.install_dir }}
when:
– correct_version is not defined
This section was added. If it was present registrations would skip
– name: Remove a file, if present
win_file:
path: C:\wazuh-agent\client.keys
state: absent
This section was added for troubleshooting purposes
#- name: Touch a file (creates if not present, updates modification time if present)
# win_file:
# path: C:\wazuh-agent\client.keys
# state: touch
– name: Windows | Check if client.keys exists
win_stat: path=”{{ wazuh_winagent_config.install_dir }}client.keys”
register: check_windows_key
notify: restart wazuh-agent windows
tags:
– config
– name: Retrieving authd Credentials
include_vars: authd_pass.yml
tags:
– config
– name: Windows | Register agent
win_shell: >
{{ wazuh_winagent_config.install_dir }}agent-auth.exe
-m {{ wazuh_managers.0.address }}
-p {{ wazuh_agent_authd.port }}
{% if authd_pass is defined %}-P {{ authd_pass }}{% endif %}
args:
chdir: “{{ wazuh_winagent_config.install_dir }}”
register: agent_auth_output
notify: restart wazuh-agent windows
when:
– wazuh_agent_authd.enable == true
– check_windows_key.stat.exists == false
– wazuh_managers.0.address is not none
tags:
– config
– name: Windows | Installing agent configuration (ossec.conf)
win_template:
src: var-ossec-etc-ossec-agent.conf.j2
dest: “{{ wazuh_winagent_config.install_dir }}ossec.conf”
notify: restart wazuh-agent windows
tags:
– config
– name: Windows | Delete downloaded Wazuh agent installer file
win_file:
path: C:\wazuh-agent-installer.msi
state: absent
These section was added as the service sometimes was not created and the agent was not restarted upon deployment which resulted in a non active client In kibana
– name: Create a new service
win_service:
name: wazuh-agent
path: C:\wazuh-agent\ossec-agent.exe
– name: Windows | Wazuh-agent Restart
win_service:
name: wazuh-agent
state: restarted
How to deploy Wazuh
Adding the Wazuh repository
The first step to setting up Wazuh is to add the Wazuh repository to your server. If you want to download the wazuh-manager package directly, or check the compatible versions, click here.
To set up the repository, run this command:
# cat > /etc/yum.repos.d/wazuh.repo <<\EOF
[wazuh_repo]
gpgcheck=1
gpgkey=https://packages.wazuh.com/key/GPG-KEY-WAZUH
enabled=1
name=Wazuh repository
baseurl=https://packages.wazuh.com/3.x/yum/
protect=1
EOF
For CentOS-5 and RHEL-5:
# cat > /etc/yum.repos.d/wazuh.repo <<\EOF
[wazuh_repo]
gpgcheck=1
gpgkey=http://packages.wazuh.com/key/GPG-KEY-WAZUH-5
enabled=1
name=Wazuh repository
baseurl=http://packages.wazuh.com/3.x/yum/5/$basearch/
protect=1
EOF
Installing the Wazuh Manager
The next step is to install the Wazuh Manager on your system:
# yum install wazuh-manager
Once the process is complete, you can check the service status with:
- For Systemd:
# systemctl status wazuh-manager
- For SysV Init:
# service wazuh-manager status
Installing the Wazuh API
- NodeJS >= 4.6.1 is required in order to run the Wazuh API. If you do not have NodeJS installed or your version is older than 4.6.1, we recommend that you add the official NodeJS repository like this:
# curl –silent –location https://rpm.nodesource.com/setup_8.x | bash –
and then, install NodeJS:
# yum install nodejs
- Python >= 2.7 is required in order to run the Wazuh API. It is installed by default or included in the official repositories in most Linux distributions.
To determine if the python version on your system is lower than 2.7, you can run the following:
# python –version
It is possible to set a custom Python path for the API in “/var/ossec/api/configuration/config.js“, in case the stock version of Python in your distro is too old:
config.python = [
// Default installation
{
bin: “python”,
lib: “”
},
// Package ‘python27’ for CentOS 6
{
bin: “/opt/rh/python27/root/usr/bin/python”,
lib: “/opt/rh/python27/root/usr/lib64”
}
];
CentOS 6 and Red Hat 6 come with Python 2.6, however, you can install Python 2.7 in parallel to maintain the older version(s):
- For CentOS 6:
# yum install -y centos-release-scl
# yum install -y python27
- For RHEL 6:
# yum install python27
You may need to first enable a repository in order to get python27, with a command like this:
# yum-config-manager –enable rhui-REGION-rhel-server-rhscl
# yum-config-manager –enable rhel-server-rhscl-6-rpms
- Install the Wazuh API. It will update NodeJS if it is required:
# yum install wazuh-api
- Once the process is complete, you can check the service status with:
- For Systemd:
# systemctl status wazuh-api
- For SysV Init:
# service wazuh-api status
Installing Filebeat
Filebeat is the tool on the Wazuh server that securely forwards alerts and archived events to the Logstash service on the Elastic Stack server(s).
Warning
In a single-host architecture (where Wazuh server and Elastic Stack are installed in the same system), the installation of Filebeat is not needed since Logstash will be able to read the event/alert data directly from the local filesystem without the assistance of a forwarder.
The RPM package is suitable for installation on Red Hat, CentOS and other modern RPM-based systems.
- Install the GPG keys from Elastic and then the Elastic repository:
# rpm –import https://packages.elastic.co/GPG-KEY-elasticsearch
# cat > /etc/yum.repos.d/elastic.repo << EOF
[elasticsearch-6.x]
name=Elasticsearch repository for 6.x packages
baseurl=https://artifacts.elastic.co/packages/6.x/yum
gpgcheck=1
gpgkey=https://artifacts.elastic.co/GPG-KEY-elasticsearch
enabled=1
autorefresh=1
type=rpm-md
EOF
- Install Filebeat Note: If you are doing an all in one setup do not install filebeat
# yum install filebeat-6.4.2
- Download the Filebeat configuration file from the Wazuh repository. This is pre-configured to forward Wazuh alerts to Logstash:
# curl -so /etc/filebeat/filebeat.yml https://raw.githubusercontent.com/wazuh/wazuh/3.6/extensions/filebeat/filebeat.yml
- Edit the file /etc/filebeat/filebeat.ymland replace ELASTIC_SERVER_IP with the IP address or the hostname of the Elastic Stack server. For example:
output:
logstash:
hosts: [“ELASTIC_SERVER_IP:5000”]
- Enable and start the Filebeat service:
- For Systemd:
# systemctl daemon-reload
# systemctl enable filebeat.service
# systemctl start filebeat.service
- For SysV Init:
# chkconfig –add filebeat
# service filebeat start
Next steps
Once you have installed the manager, API and Filebeat (only needed for distributed architectures), you are ready to install
Installing Elastic Stack
This guide describes the installation of an Elastic Stack server comprised of Logstash, Elasticsearch, and Kibana. We will illustrate package-based installations of these components. You can also install them from binary tarballs, however, this is not preferred or supported under Wazuh documentation.
In addition to Elastic Stack components, you will also find the instructions to install and configure the Wazuh app (deployed as a Kibana plugin).
Depending on your operating system you can choose to install Elastic Stack from RPM or DEB packages. Consult the table below and choose how to proceed:
Install Elastic Stack with RPM packages
The RPM packages are suitable for installation on Red Hat, CentOS and other RPM-based systems.
Note
Many of the commands described below need to be executed with root user privileges.
Preparation
- Oracle Java JRE 8 is required by Logstash and Elasticsearch.
Note
The following command accepts the necessary cookies to download Oracle Java JRE. Please, visit Oracle Java 8 JRE Download Page for more information.
# curl -Lo jre-8-linux-x64.rpm –header “Cookie: oraclelicense=accept-securebackup-cookie” “https://download.oracle.com/otn-pub/java/jdk/8u191-b12/2787e4a523244c269598db4e85c51e0c/jre-8u191-linux-x64.rpm”
Now, check if the package was download successfully:
# rpm -qlp jre-8-linux-x64.rpm > /dev/null 2>&1 && echo “Java package downloaded successfully” || echo “Java package did not download successfully”
Finally, install the RPM package using yum:
# yum -y install jre-8-linux-x64.rpm# rm -f jre-8-linux-x64.rpm
- Install the Elastic repository and its GPG key:
# rpm –import https://packages.elastic.co/GPG-KEY-elasticsearch # cat > /etc/yum.repos.d/elastic.repo << EOF[elasticsearch-6.x]name=Elasticsearch repository for 6.x packagesbaseurl=https://artifacts.elastic.co/packages/6.x/yumgpgcheck=1gpgkey=https://artifacts.elastic.co/GPG-KEY-elasticsearchenabled=1autorefresh=1type=rpm-mdEOF
Elasticsearch
Elasticsearch is a highly scalable full-text search and analytics engine. For more information, please see Elasticsearch.
- Install the Elasticsearch package:
# yum install elasticsearch-6.4.2
- Enable and start the Elasticsearch service:
- For Systemd:
# systemctl daemon-reload# systemctl enable elasticsearch.service# systemctl start elasticsearch.service
- For SysV Init:
# chkconfig –add elasticsearch# service elasticsearch start
It’s important to wait until the Elasticsearch server finishes starting. Check the current status with the following command, which should give you a response like the shown below:
# curl “localhost:9200/?pretty” { “name” : “Zr2Shu_”, “cluster_name” : “elasticsearch”, “cluster_uuid” : “M-W_RznZRA-CXykh_oJsCQ”, “version” : { “number” : “6.4.2”, “build_flavor” : “default”, “build_type” : “rpm”, “build_hash” : “053779d”, “build_date” : “2018-07-20T05:20:23.451332Z”, “build_snapshot” : false, “lucene_version” : “7.3.1”, “minimum_wire_compatibility_version” : “5.6.0”, “minimum_index_compatibility_version” : “5.0.0” }, “tagline” : “You Know, for Search”}
- Load the Wazuh template for Elasticsearch:
# curl https://raw.githubusercontent.com/wazuh/wazuh/3.6/extensions/elasticsearch/wazuh-elastic6-template-alerts.json | curl -XPUT ‘http://localhost:9200/_template/wazuh’ -H ‘Content-Type: application/json’ -d @-
Note
It is recommended that the default configuration be edited to improve the performance of Elasticsearch. To do so, please see Elasticsearch tuning.
Logstash
Logstash is the tool that collects, parses, and forwards data to Elasticsearch for indexing and storage of all logs generated by the Wazuh server. For more information, please see Logstash.
- Install the Logstash package:
# yum install logstash-6.4.2
- Download the Wazuh configuration file for Logstash:
- Local configuration (only in a single-host architecture):
- # curl -so /etc/logstash/conf.d/01-wazuh.conf https://raw.githubusercontent.com/wazuh/wazuh/3.6/extensions/logstash/01-wazuh-local.conf
Because the Logstash user needs to read the alerts.json file, please add it to OSSEC group by running:
# usermod -a -G ossec logstash
- Remote configuration (only in a distributed architecture):
- # curl -so /etc/logstash/conf.d/01-wazuh.conf https://raw.githubusercontent.com/wazuh/wazuh/3.6/extensions/logstash/01-wazuh-remote.conf
Note
Follow the next steps if you use CentOS-6/RHEL-6 or Amazon AMI (logstash uses Upstart like a service manager and needs to be fixed, see this bug):
- Edit the file /etc/logstash/startup.options changing line 30 from LS_GROUP=logstashto LS_GROUP=ossec.
- Update the service with the new parameters by running the command /usr/share/logstash/bin/system-install
- Restart Logstash.
- Enable and start the Logstash service:
- For Systemd:
# systemctl daemon-reload
# systemctl enable logstash.service
# systemctl start logstash.service
- For SysV Init:
# chkconfig –add logstash
# service logstash start
Note
If you are running the Wazuh server and the Elastic Stack server on separate systems (distributed architecture), it is important to configure encryption between Filebeat and Logstash. To do so, please see Setting up SSL for Filebeat and Logstash.
Kibana
Kibana is a flexible and intuitive web interface for mining and visualizing the events and archives stored in Elasticsearch. Find more information at Kibana.
- Install the Kibana package:
# yum install kibana-6.4.2
- Install the Wazuh app plugin for Kibana:
- Increase the default Node.js heap memory limit to prevent out of memory errors when installing the Wazuh app. Set the limit as follows:
# export NODE_OPTIONS=“–max-old-space-size=3072”
- Install the Wazuh app:
# sudo -u kibana /usr/share/kibana/bin/kibana-plugin install https://packages.wazuh.com/wazuhapp/wazuhapp-3.6.1_6.4.2.zip
Warning
The Kibana plugin installation process may take several minutes. Please wait patiently.
Note
If you want to download a different Wazuh app plugin for another version of Wazuh or Elastic Stack, check the table available at GitHub and use the appropriate installation command.
- Kibana will only listen on the loopback interface (localhost) by default. To set up Kibana to listen on all interfaces, edit the file /etc/kibana/kibana.yml uncommenting the setting server.host. Change the value to:
server.host: “0.0.0.0”
Note
It is recommended that an Nginx proxy be set up for Kibana in order to use SSL encryption and to enable authentication. Instructions to set up the proxy can be found at Setting up SSL and authentication for Kibana.
- Enable and start the Kibana service:
- For Systemd:
# systemctl daemon-reload
# systemctl enable kibana.service
# systemctl start kibana.service
- For SysV Init:
# chkconfig –add kibana
# service kibana start
- Disable the Elasticsearch repository:
It is recommended that the Elasticsearch repository be disabled in order to prevent an upgrade to a newer Elastic Stack version due to the possibility of undoing changes with the App. To do this, use the following command:
# sed -i “s/^enabled=1/enabled=0/” /etc/yum.repos.d/elastic.repo
Setup password for wazuh-manager
Securing the Wazuh API
By default, the communications between the Wazuh Kibana App and the Wazuh API are not encrypted. You should take the following actions to secure the Wazuh API.
- Change default credentials:
By default you can access by typing user “foo” and password “bar”. We recommend you to generate new credentials. This can be done very easily, with the following steps:
$ cd /var/ossec/api/configuration/auth
$ sudo node htpasswd -c user myUserName
- Enable HTTPS:
In order to enable HTTPS you need to generate or provide a certificate. You can learn how to generate your own certificate or generate it automatically using the script/var/ossec/api/scripts/configure_api.sh.
- Bind to localhost:
In case you do not need to acces to the API externally, you should bind the API tolocalhostusing the optionconfig.hostplaced in the configuration file/var/ossec/api/configuration/config.js.
How to deploy ansibleconfigure powershell script on windows
Okay fun stuff, so I tried this a number of ways which I will describe in this blog post.
So if your windows server is joined to the domain and you have a machine that can reach all he virtual machines, WinRM is configured, and you have powershell 3.0 or higher setup.
Then you could try the following powershell for loop from SYSVOL share
Sample powershell For Loop
powershell loop deploy – ask credentials
$serverfiles=import-CSV ‘d:\scripts\hosts.csv’
$cred = get-credential
Foreach ($server in $serverfiles) {
write-output $server.names
invoke-command -computername $server.names -filepath d:\scripts\ansibleconfigure.ps1 -credential $cred
}
Note: This method sucked and failed for me due to WinRM not being there and other restrictions like host having. The other was I’m not exactly powershell intermediate had to muddle around a lot.
What you want to do here is copy the configure script to SYSVOL so all the joined machines can reach the script.
In the search bar type: (replace domain to match)


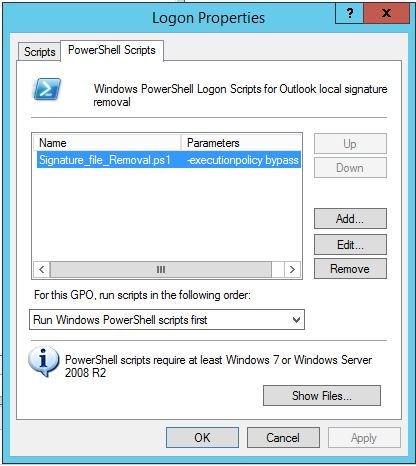
script name